Profiling A ‘Real Assets’ Portfolio During The Recent Inflation Surge

The sharp runup in US inflation in 2021-2022 revived the idea that a so-called real assets portfolio is crucial for asset allocation strategies… But with the peaking of inflation in mid-2022, the outlook has turned murky for a dedicated focus on assets that are expected to benefit from higher pric…
The sharp runup in US inflation in 2021-2022 revived the idea that a so-called real assets portfolio is crucial for asset allocation strategies. But with the peaking of inflation in mid-2022, the outlook has turned murky for a dedicated focus on assets that are expected to benefit from higher pricing pressure.
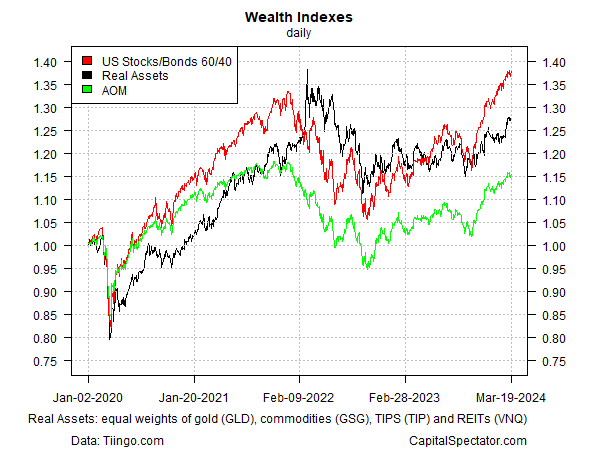
For perspective, let’s assume that a real assets portfolio is comprised of four groups via their ETF proxies: commodities (GSG), gold (GLD), inflation-protected Treasuries (TIP) and real estate (VNQ). These components are equally weighted and rebalanced at the end of each calendar year. For comparison, the performance chart below also includes a 60/40 US stocks/bonds (SPY/BND) strategy and the iShares Core Moderate Allocation ETF (AOM). We’ll use the start date of Dec. 31, 2019 for a review of how a real assets strategy compares — the eve of what might be called the period of great chaos that eventually unleashed the recent inflation surge.

The main takeaway: this real-assets benchmark has done rather well. Notably, it outperformed during the early part of 2022, when markets generally took a heavy blow. Real assets have had a tough time keeping up with a 60/40 strategy recently, but that’s because the red-hot US equities market has been so hard to match. A moderate allocation strategy, meanwhile, has had a rough time keeping up.
Bold portfolio strategies, in short, have paid off handsomely in recent years.
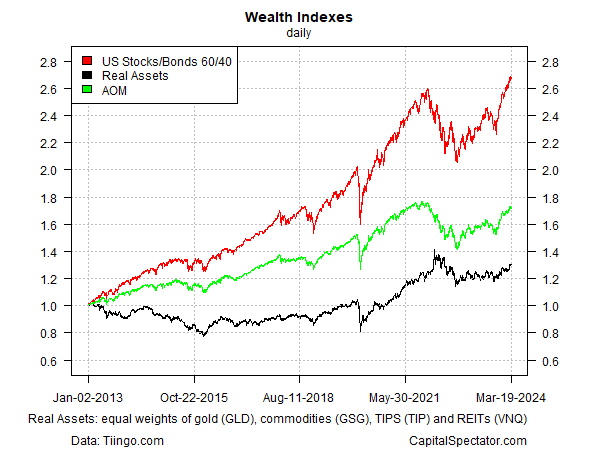
But the question is whether recent history is a reasonable guide? Minds will differ after digesting the second chart below, which moves the start date back to the end of 2012. On that basis, real assets have been a significant laggard while a US 60/40 portfolio has skyrocketed.

There are several caveats here, of course, which serve as discussion points that deserve closer review. That starts with the definition of “real assets.” For some folks, that club should include crypto currency, which is now available in ETF form for bitcoin.
There’s also the question of whether a tactical overlay for managing a real assets portfolio would improve results vs. the quasi-passive approach reviewed above. Ditto for rethinking an equal weighting system and/or a more granular or expansive opportunity set for tapping into real assets.
Perhaps the crucial question is whether inflation will remain a driving force that keeps real assets competitive in the years ahead? There are several ways to think about this, and a strategist can’t spend too much on this point for a simple reason: an inflation-driven tailwind, or the absence thereof, will determine a hefty degree of the results for a real-assets strategy in the years ahead.
The baseline assumption for asset allocation design is that real assets should be included, and for a good reason: the future’s always uncertain and a medium-/long-term investor shouldn’t take the risk of being low on inflation protection. But as the longer-term chart above reminds, there’s a non-trivial possibility that real assets can be a drag on results for an extended period of time. If inflation continues to moderate, which seems likely in the near term, the value of real assets in a diversified strategy will remain challenged.
Learn To Use R For Portfolio Analysis
Quantitative Investment Portfolio Analytics In R:
An Introduction To R For Modeling Portfolio Risk and Return
By James Picerno
Author: James Picerno
