10-Year US Treasury Yield ‘Fair Value’ Estimate: 11 April 2024

Yesterday’s hotter-than-expected consumer inflation report suggests that a hefty market premium will endure, and perhaps rise further, in the near term — until there’s clearer evidence that the Federal Reserve has more traction in reaching its 2% target… “That’s now turning into a…
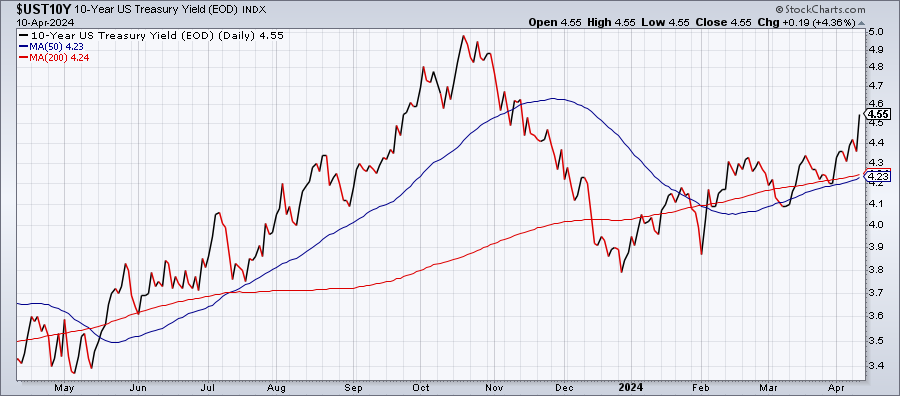
The market continues to price the US 10-year Treasury yield well above its estimated “fair value,” based on the average of three models run by CapitalSpectator.com.
Yesterday’s hotter-than-expected consumer inflation report suggests that a hefty market premium will endure, and perhaps rise further, in the near term — until there’s clearer evidence that the Federal Reserve has more traction in reaching its 2% target. For the moment, however, confidence on that front has taken a hit. As a result, the 10-year yield spiked on Wednesday (Apr. 10) as the market priced in lower expectations that the central bank will cut interest rates in the near future.

“Everyone was looking for shelter costs to come down but they’re not cooperating. We have a strong economy, with tight inventories and pricing power for companies,” says David Russell, global head of market strategy at TradeStation. “That’s now turning into a double-edged sword, making inflation stickier than we hoped. Rate cuts could be out the window.”
Former Treasury Sec. Larry Summers advises: “You have to take seriously the possibility that the next rate move will be upwards rather than downwards.”
How is recession risk evolving? Monitor the outlook with a subscription to:
The US Business Cycle Risk Report
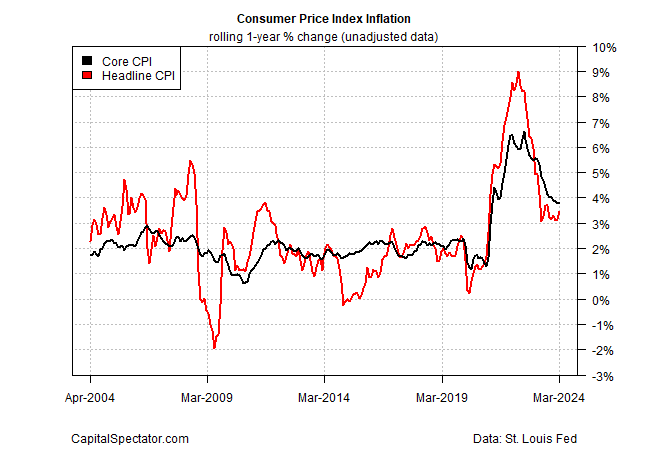
Keep in mind, however, that while headline consumer inflation was firmer in March on a year-over-year basis, core CPI was essentially steady. If core inflation is a more reliable measure of the trend, as many economists argue, it’s premature to rule out the possibility that disinflation is dead.

The bad news is that there’s room for debate. Looking at a broader range of inflation metrics suggests that an upward bias may be unfolding for pricing pressure, based on the average year-over-year trend for six measures of CPI. The chart below, in addition to the standard core CPI data, includes five alternative CPI metrics, published by the Atlanta and Cleveland Federal Reserve banks: Sticky Core CPI, Sticky Core CPI Ex-shelter, Median CPI, Flexible CPI and Flexible core CPI.

One pushback is that CapitalSpectator.com’s ensemble model for the standard core CPI reading remains on track to ease in terms of year-over-year comparisons. Although this projection comes with all the usual caveats, it’s encouraging that this modeling has been generally accurate in recent history. Whether it remains so is unclear, but for the moment it provides support for keeping an open mind on whether the recent round of sticky inflation is a temporary setback for disinflation or an early warning that reinflation is emerging.

Meanwhile, today’s revised fair value estimate of the 10-year yield through March continues to print well below the market value of the benchmark rate, based on the average of three models.

Tracking the difference in the average fair value vs. the market rate continues to reflect a substantial premium. The current differential is about 100 basis. That’s a high market premium, although it’s fallen from the cyclical peak in late-2023.

The debate is whether the market premium could rise anew and perhaps reach, or even top, the previous peak set last year. That’s unlikely, unless we see firmer evidence that inflation is reaccelerating. For now, that’s just a forecast compared with the more compelling view that inflation remains sticky at current levels. If and when the sticky data gives way, up or down, the fair value estimate will change accordingly, as will the market rate. Based on the current data, however, the view that inflation is reaccelerating remains weak, albeit a bit less weak vs. last month.
Author: James Picerno

