

AI-powered event response for Amazon EKS

Cloud environments with dozens of microservices are now easier to manage than ever, and modern DevOps teams are well-equipped to balance rapid deployments with operational stability — even as monitoring tools surface thousands of daily signals… AWS DevOps Agent is a fully managed autonomous AI …
Cloud environments with dozens of microservices are now easier to manage than ever, and modern DevOps teams are well-equipped to balance rapid deployments with operational stability — even as monitoring tools surface thousands of daily signals.
AWS DevOps Agent is a fully managed autonomous AI Agent that resolves and proactively prevents incidents, continuously improving reliability and performance of applications in AWS, multicloud, and hybrid environments. It brings Kubernetes-native intelligence to incident response. It understands how Pods relate to Deployments, which Services route traffic, what ConfigMaps provide configuration, and how these components interact across your environment. Rather than seeing isolated infrastructure issues, the agent comprehends the architectural relationships that matter most for fast, accurate root cause analysis. In this post, you’ll learn how AWS DevOps Agent integrates with your existing observability stack to provide intelligent, automated responses to system events.
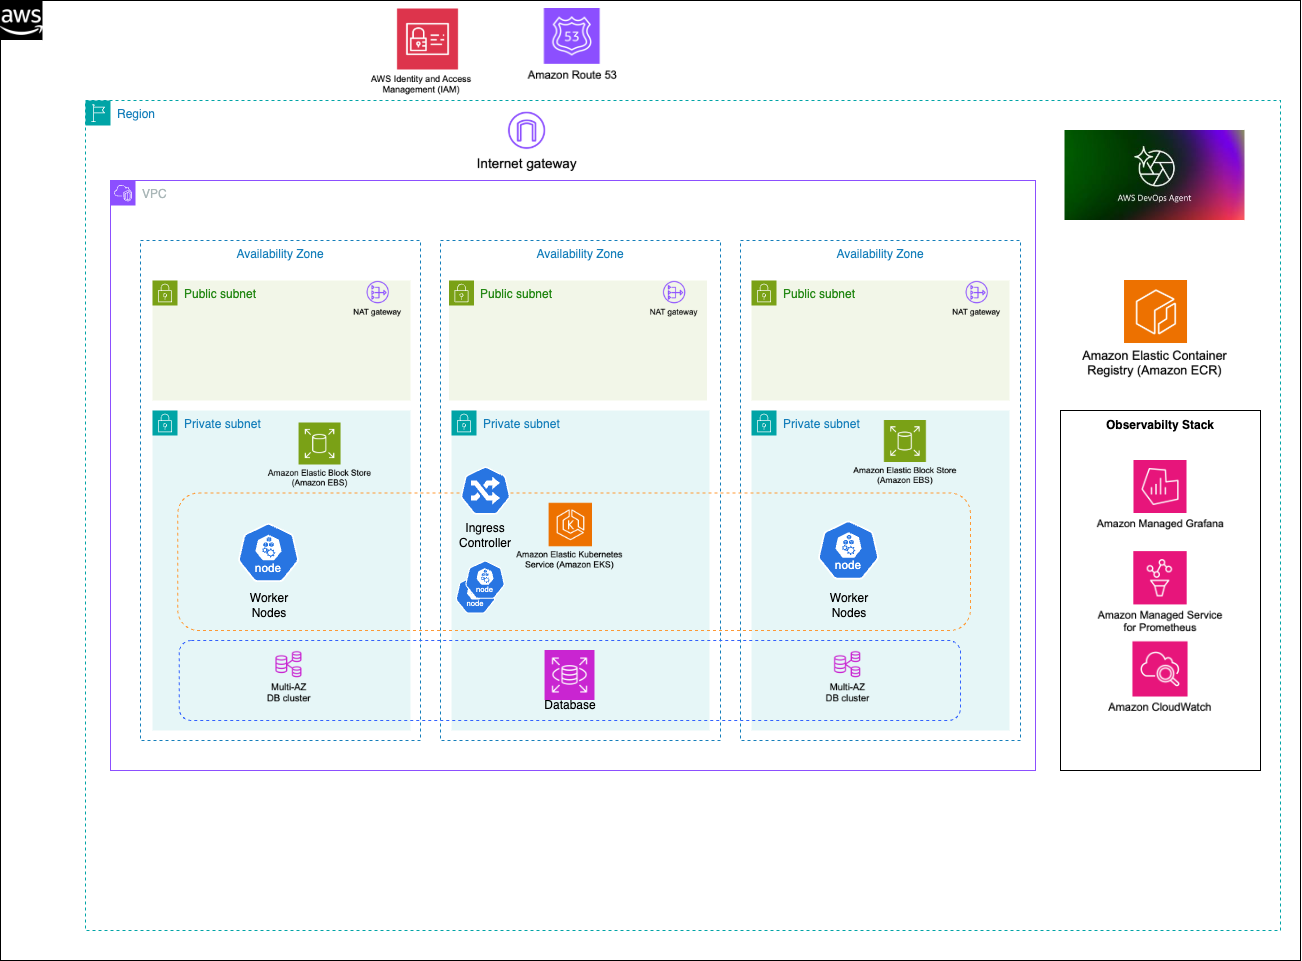 Figure 1: This is an example of target architecture of how Amazon EKS workloads are deployed and how AWS DevOps agent can interact with the different managed services like Amazon CloudWatch
How AWS DevOps Agent discovers Kubernetes resources
Built on Amazon Bedrock, the agent can analyze complex operational scenarios and correlate data from multiple sources. AWS DevOps Agent combines natural language processing (NLP) of logs and error messages with root cause analysis, powered by machine learning (ML), to automatically identify issues across your infrastructure.
Telemetry-based discovery
The agent analyzes OpenTelemetry data to infer runtime relationships:
- Service Mesh Analysis: Examines network traffic patterns between pods to identify service-to-service communication
- Trace Correlation: Uses distributed traces to map request flows across microservices
- Metric Attribution: Associates performance metrics with specific pods, containers, and nodes
Metadata enrichment
The agent enriches discovered resources with contextual information:
- Labels and Annotations: Extracts application metadata, ownership information, and deployment details
- Resource Specifications: Captures CPU/memory requests and limits, health check configurations, and environmental variables
- Network Topology: Maps pod IPs, service cluster IPs, ingress rules, and network policies
Discovery process
When you start an investigation, the agent executes the following discovery workflow:
- Initial Scan: Queries the Kubernetes API for all resources in relevant namespaces
- Dependency Analysis: Builds a dependency graph showing how resources relate to each other
- Telemetry Correlation: Matches discovered resources with their corresponding metrics, logs, and traces
- Context Building: Aggregates resource state, recent events, and performance data into a unified view
Implementation details
Prerequisites
Before implementing this solution, verify that you have the following:
- AWS Account
- AWS Command Line Interface (AWS CLI) version 2.15.0 or later
- Kiro CLI version 1.25.0 or later
- AWS Identity and Access Management (IAM) role following policy of least privilege permissions.
- Amazon Elastic Kubernetes Service (Amazon EKS) cluster version 1.27 or later
- OpenTelemetry Operator installed for telemetry collection
- Amazon Managed Service for Prometheus workspace configured
- AWS Distro for OpenTelemetry (ADOT) Collector deployed
- Container Insights enabled for Amazon CloudWatch integration
- AWS X-Ray integration configured for distributed tracing
Development environment
- Docker 24.0+ and AWS CLI configured
- AWS Cloud Development Kit (AWS CDK) v2 version 2.238.0
- AWS Serverless Application Model (AWS SAM) CLI version 1.154.0 for serverless deployment
As part of the setup and the applications that are mentioned in the following sections. We have this AWS samples repo with deployable scripts and setup instructions.
This section walks you through deploying and configuring the complete AWS DevOps Agent demo environment.
Step 1: Deploy AWS DevOps Agent infrastructure
Begin by deploying the AWS DevOps Agent using the AWS CDK. The infrastructure includes the Agent Space configuration, IAM roles and policies, and integration with your EKS cluster.
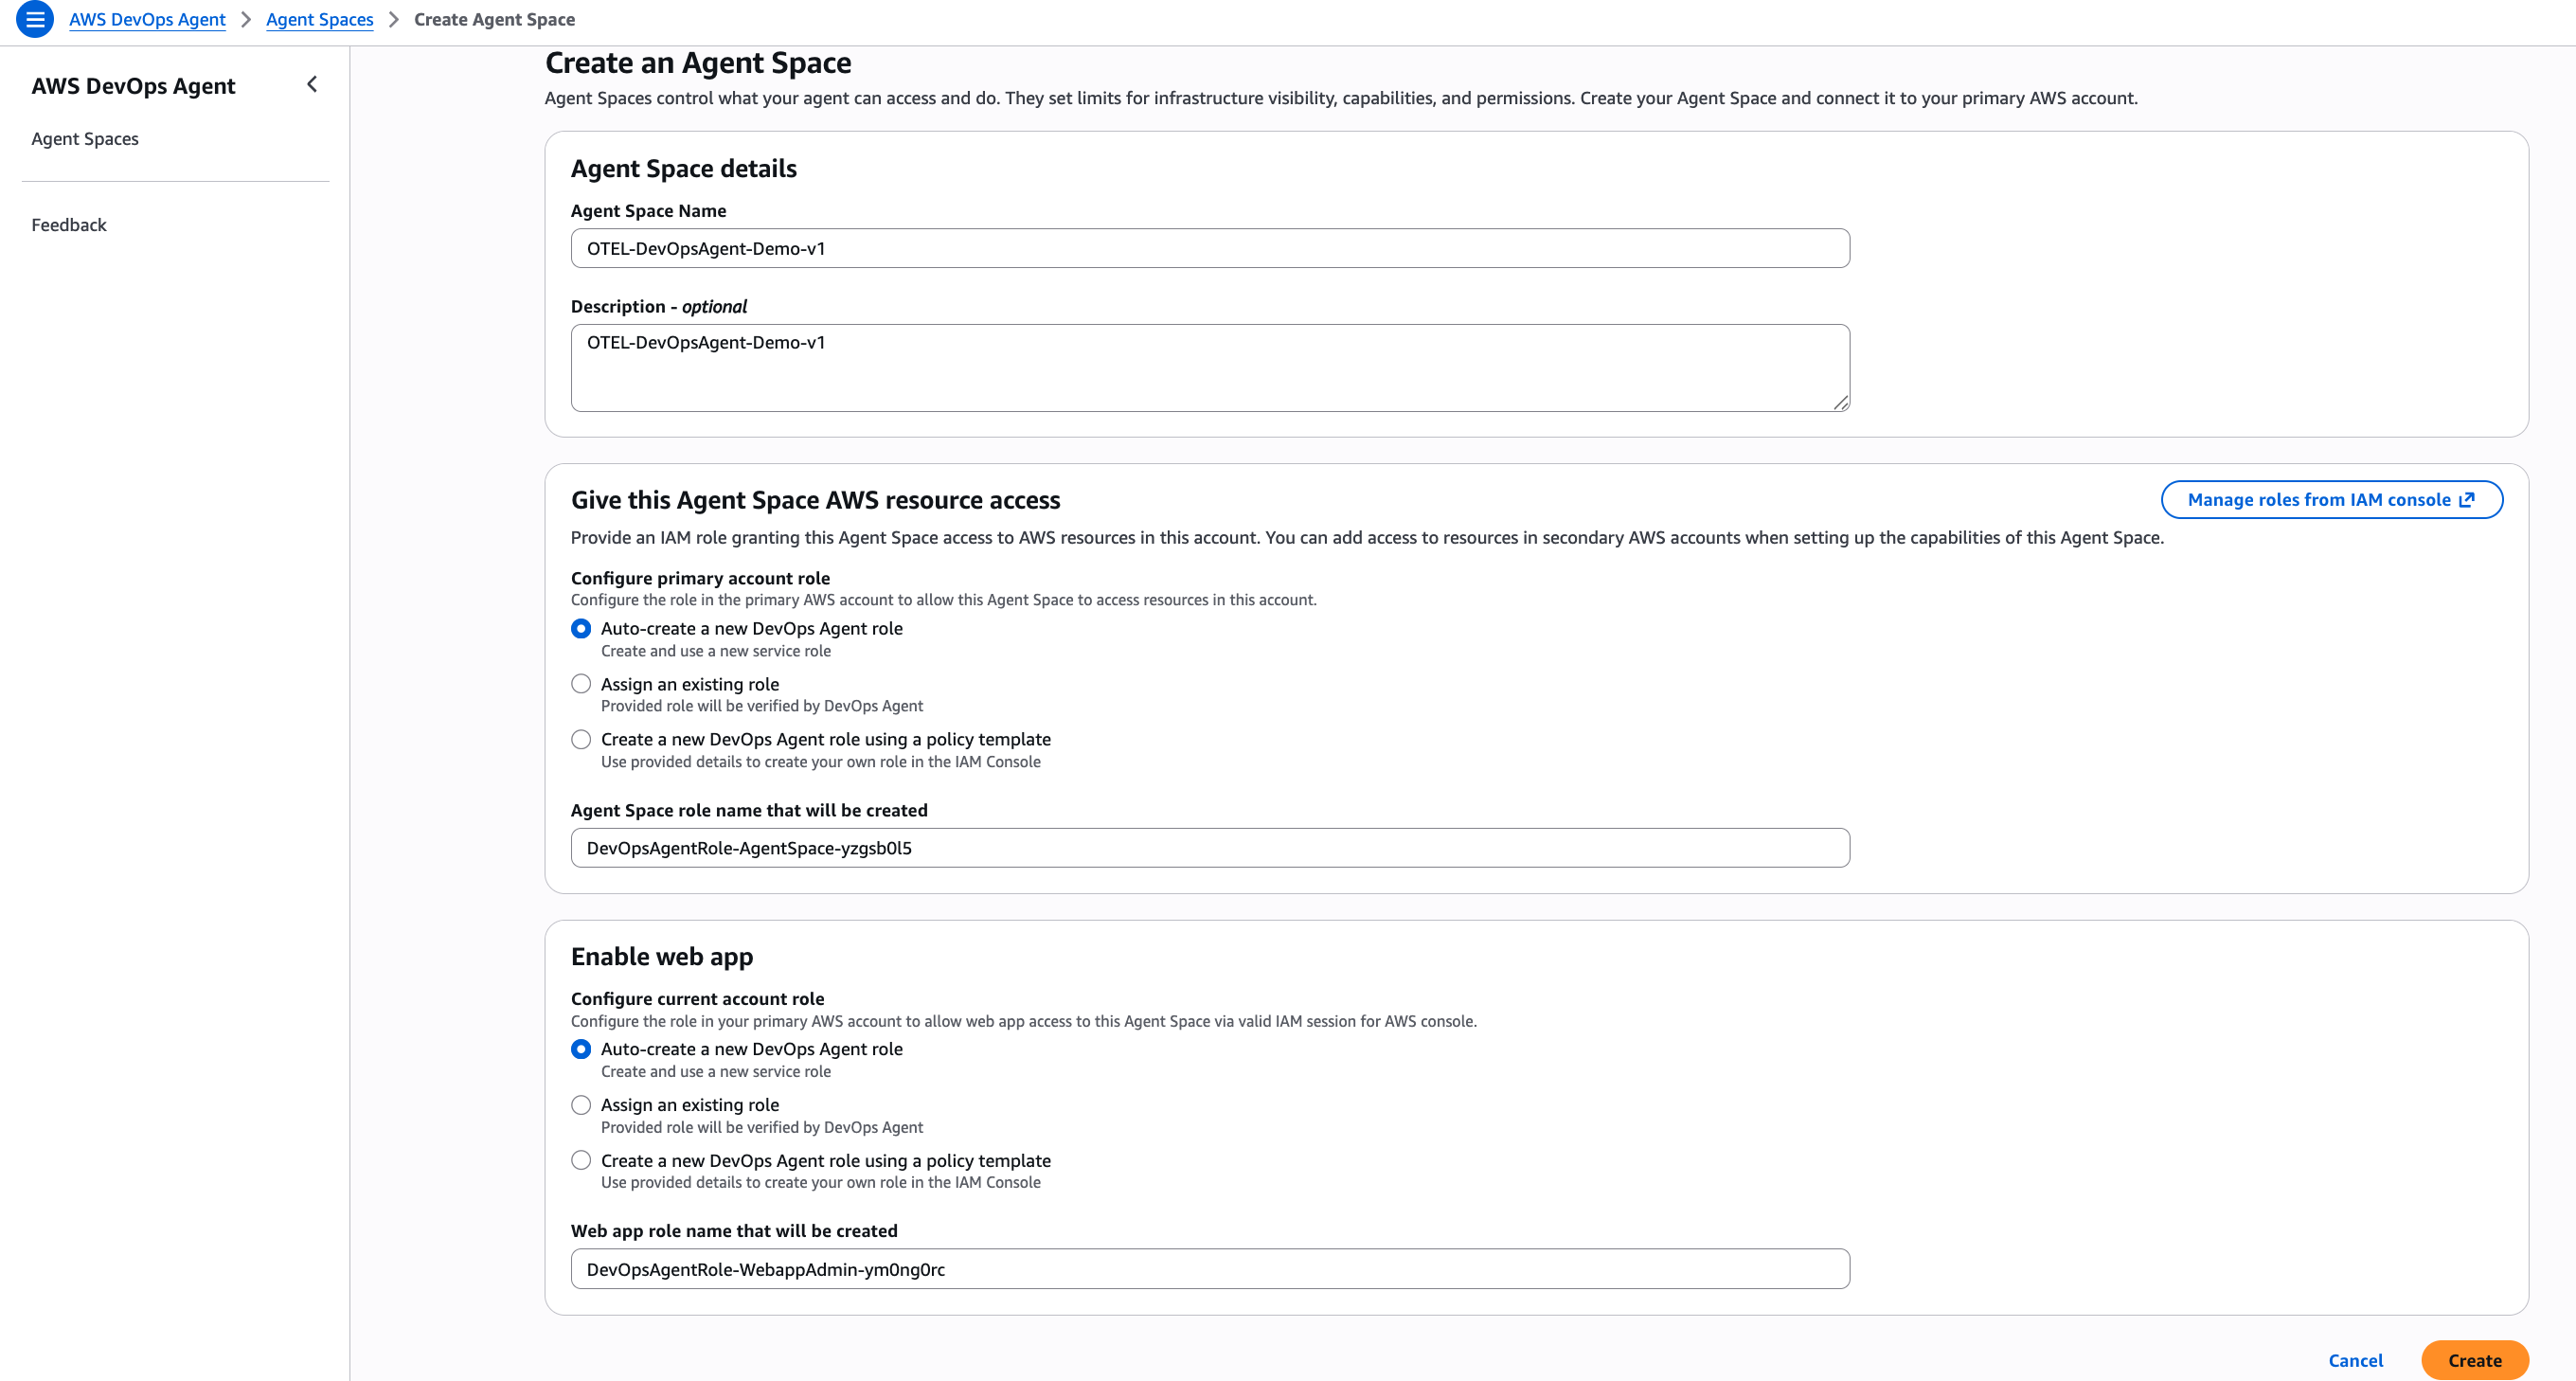
Figure 2: This is screenshot of configuring the Agent Space in the AWS Console
Configure the Agent Space in the AWS Console by navigating to the AWS DevOps Agent service. You will then create a new Agent Space for your EKS cluster. Finally, you will set up data source integrations including Prometheus workspace endpoints, Amazon CloudWatch Log groups, and X-Ray service configuration.
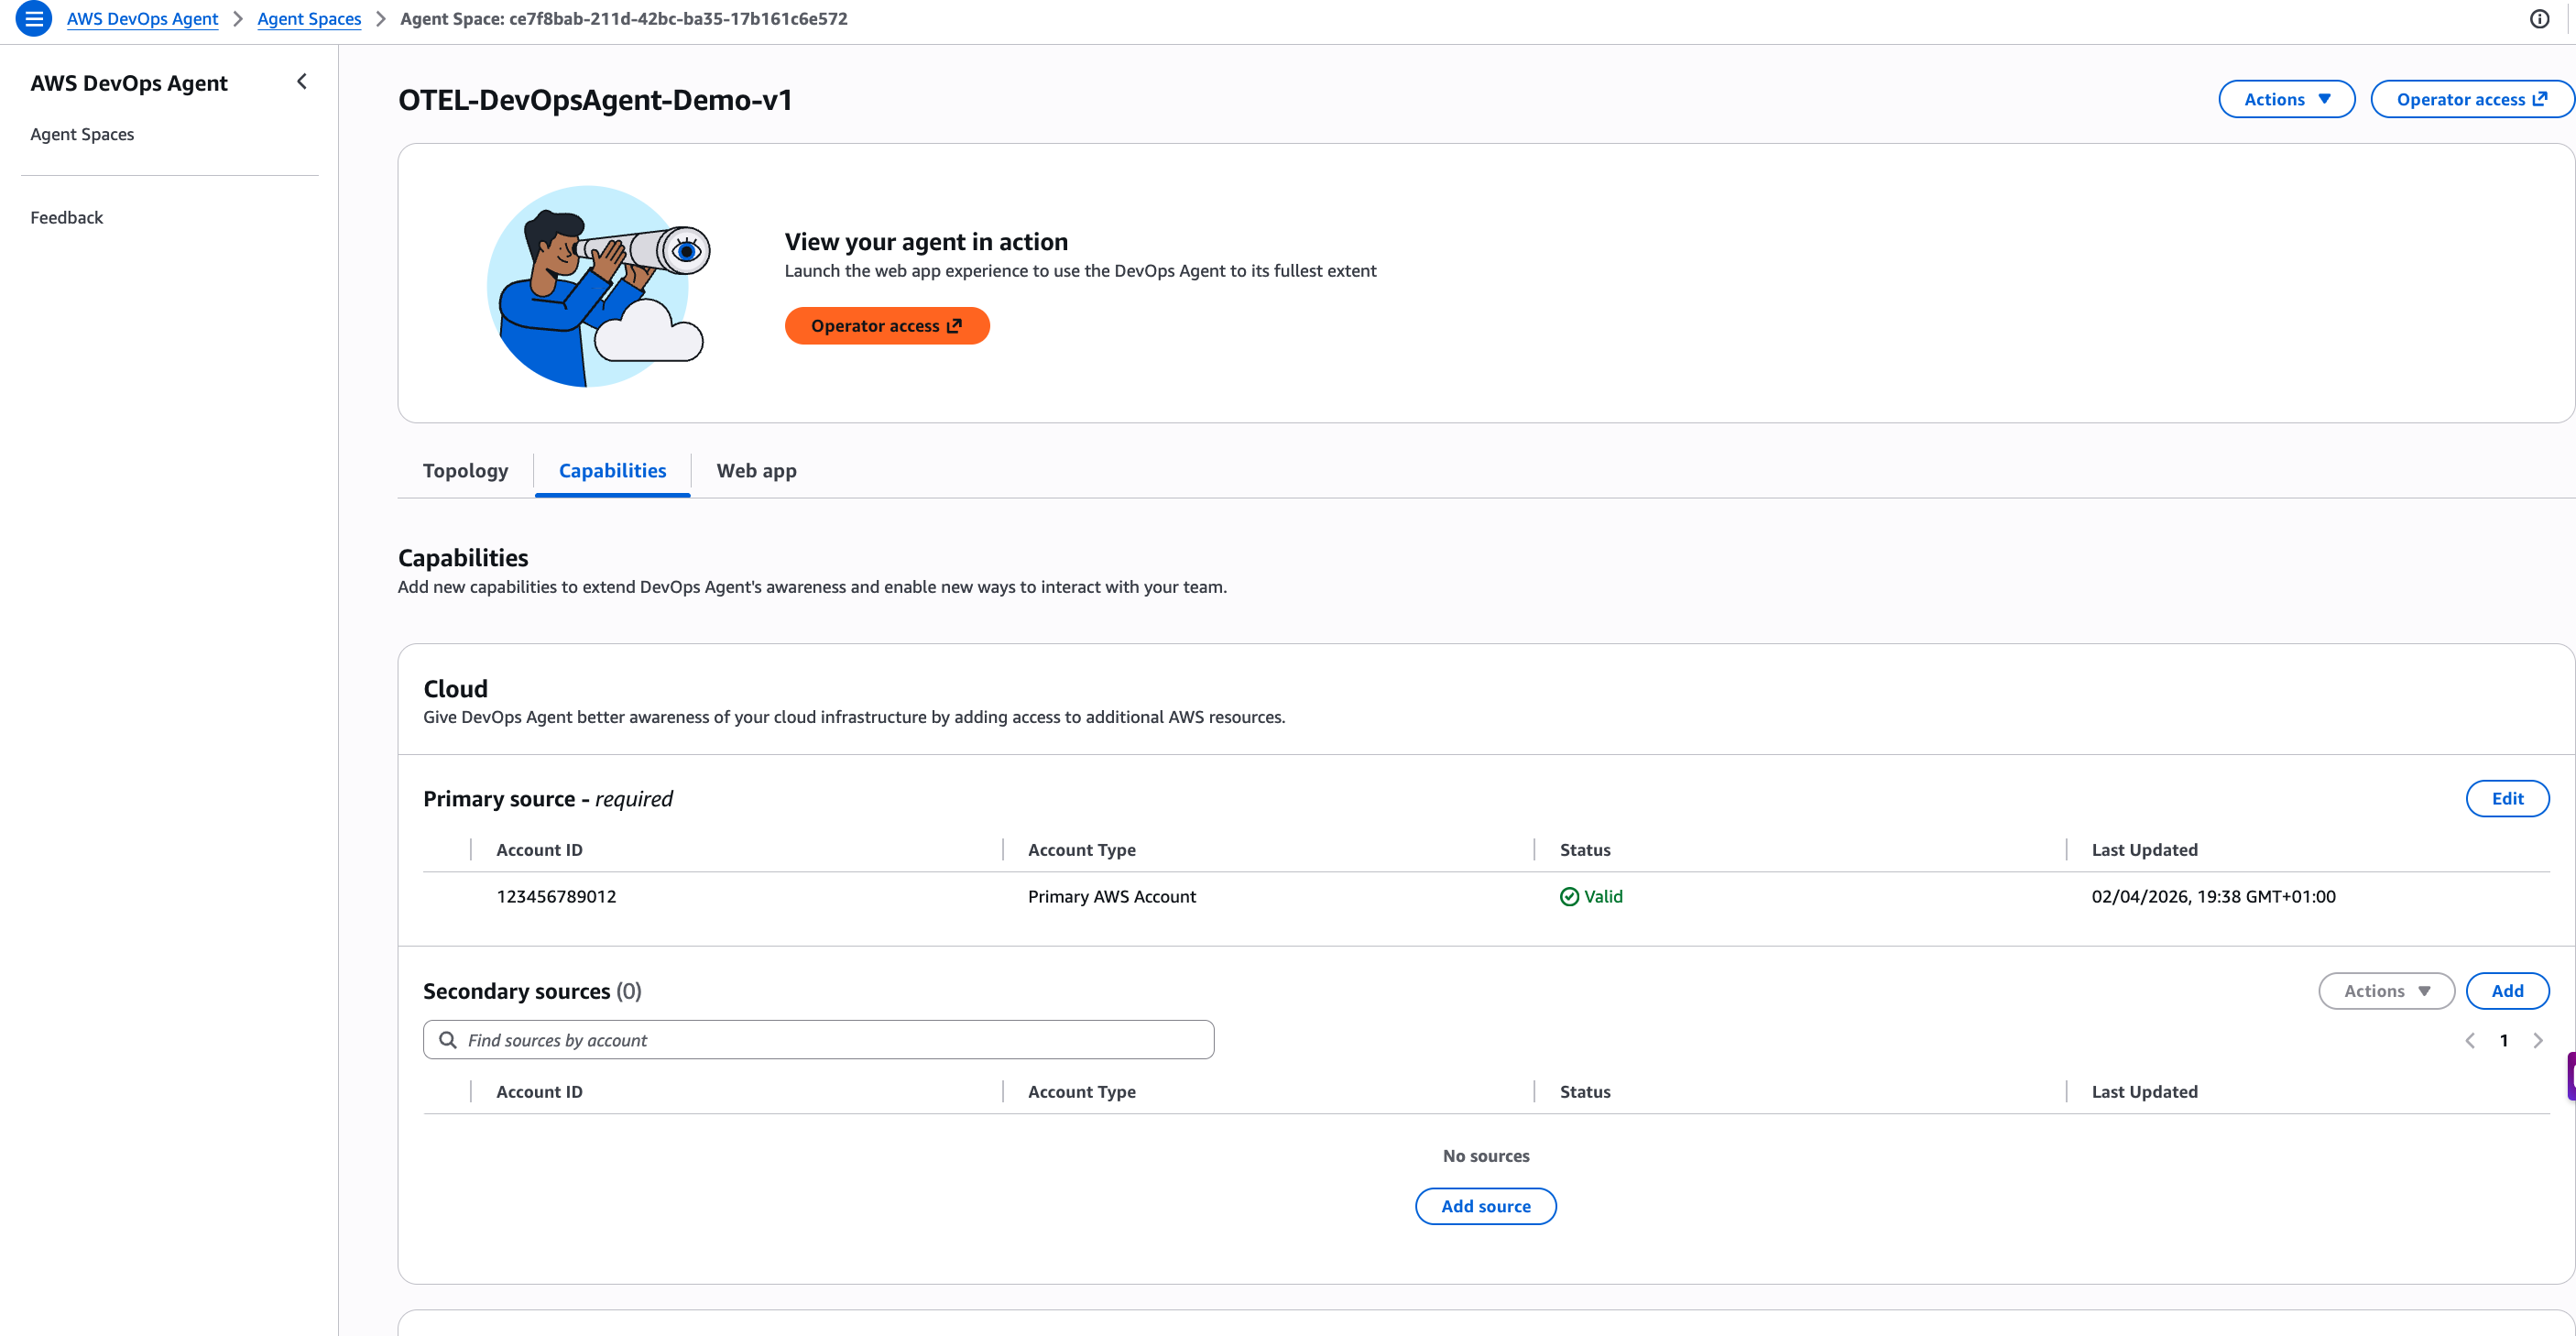 Figure 3: This is screenshot of validating the connectivity to data sources and access to the AWS account
Validate the deployment by accessing the DevOps Agent web interface, verifying connectivity to data sources, and confirming that the agent can discover your EKS cluster resources.
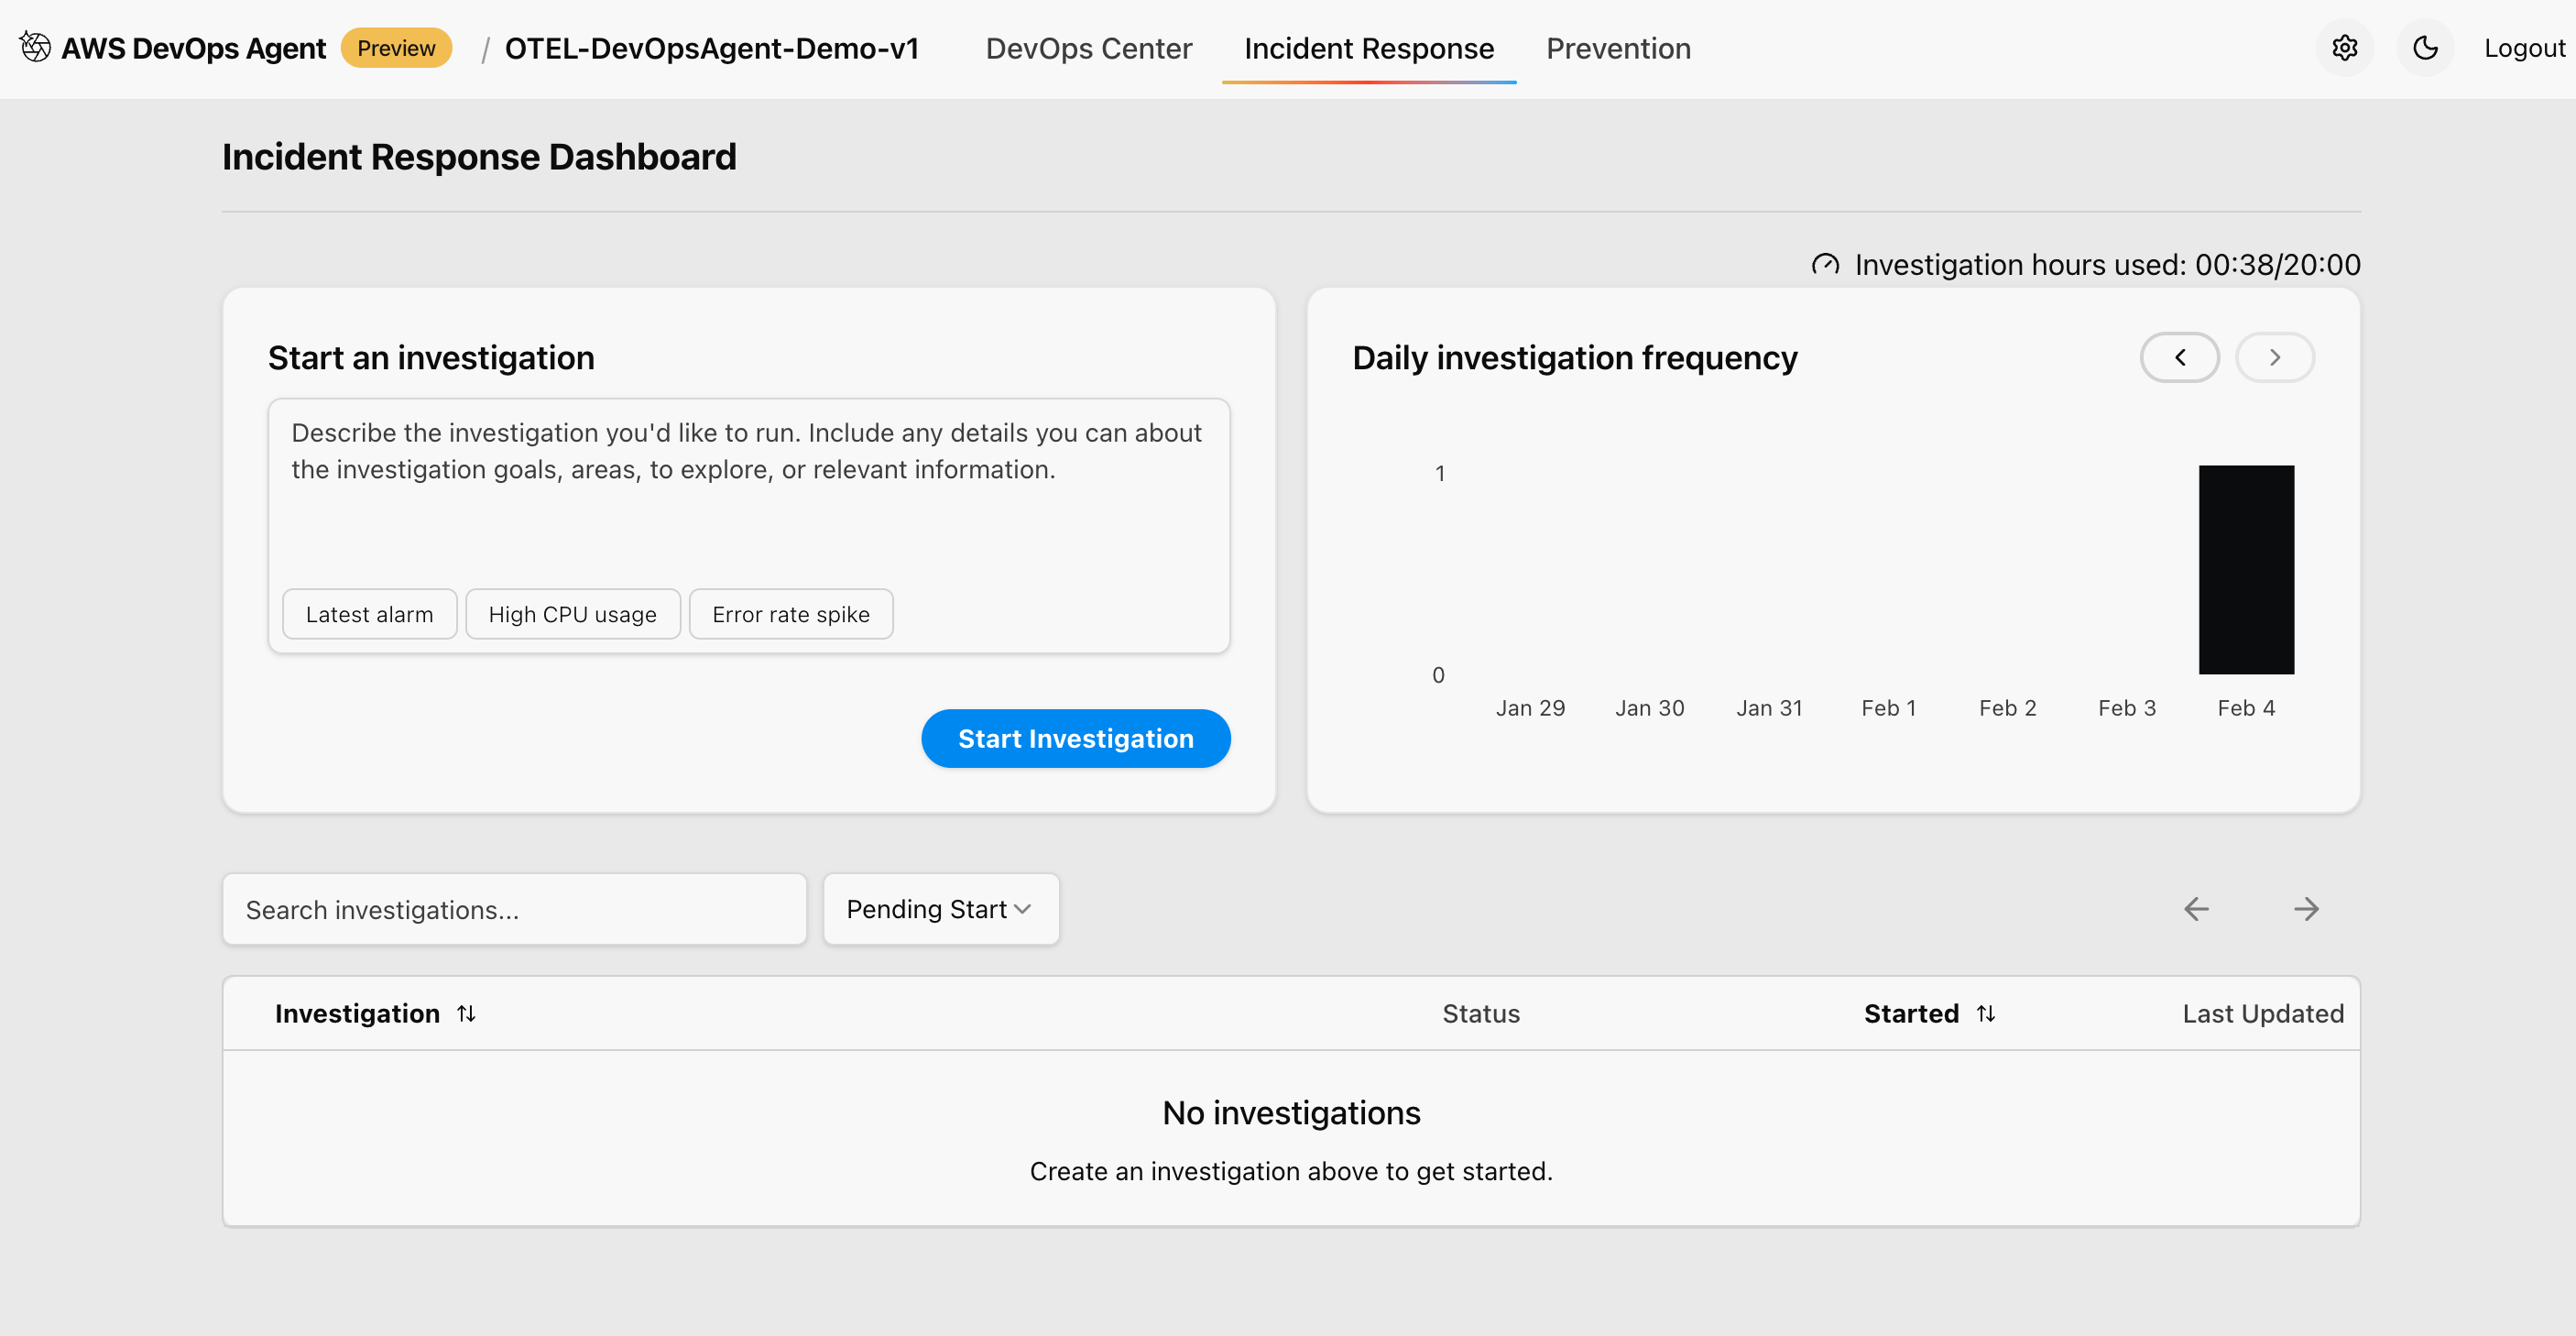
Figure 4: This is screenshot of checking the incident response and if there is any ongoing investigation
Step 2: Set up port forwarding for applications
Configure port forwarding to enable the traffic generator to access your deployed applications. Set up port forwarding for all sample applications using “kubectl” commands. Each application runs on different ports to simulate a realistic microservices environment:
# Sample Metrics App (port 8000)
kubectl port-forward svc/sample-metrics-app 8000:8000 -n default &
# Python OTEL App (port 8080)
kubectl port-forward svc/otel-sample-app 8080:8000 -n default &
# Go OTEL App (port 8090)
kubectl port-forward svc/go-otel-sample-app 8090:8080 -n default &
# Java OTEL App (port 8081)
kubectl port-forward svc/java-otel-sample-app 8081:8080 -n default &
Step 3: Install and configure Traffic Generator
The traffic generator is a Python-based tool that creates realistic load patterns and error scenarios for testing AWS DevOps Agent capabilities. Install the required Python dependencies and make the traffic generator executable:
# Install required Python packages
pip install requests
# Make the script executable
chmod +x traffic-generator.py
The traffic generator supports multiple configuration options for creating different testing scenarios.
Step 4: Generate baseline traffic
Create baseline operational data by generating normal traffic patterns across all applications. This establishes normal operational patterns that AWS DevOps Agent can learn from. Generate steady traffic to establish baseline metrics:
# Generate normal baseline traffic
python traffic-generator.py --app all --duration 900 --rps 10 --error-rate 0.05
This command generates traffic to all applications for 15 minutes at 10 requests per second with a 5% error rate, simulating normal operational conditions. Monitor the baseline traffic generation by checking application metrics and HPA scaling behavior:
# View HPA status (should show scaling based on metrics)
kubectl get hpa -A
# Check custom metrics availability
kubectl get --raw /apis/custom.metrics.k8s.io/v1beta1 | jq .
# View specific metric values
kubectl get --raw /apis/custom.metrics.k8s.io/v1beta1/namespaces/default/pods/*/sample_app_requests_rate | jq .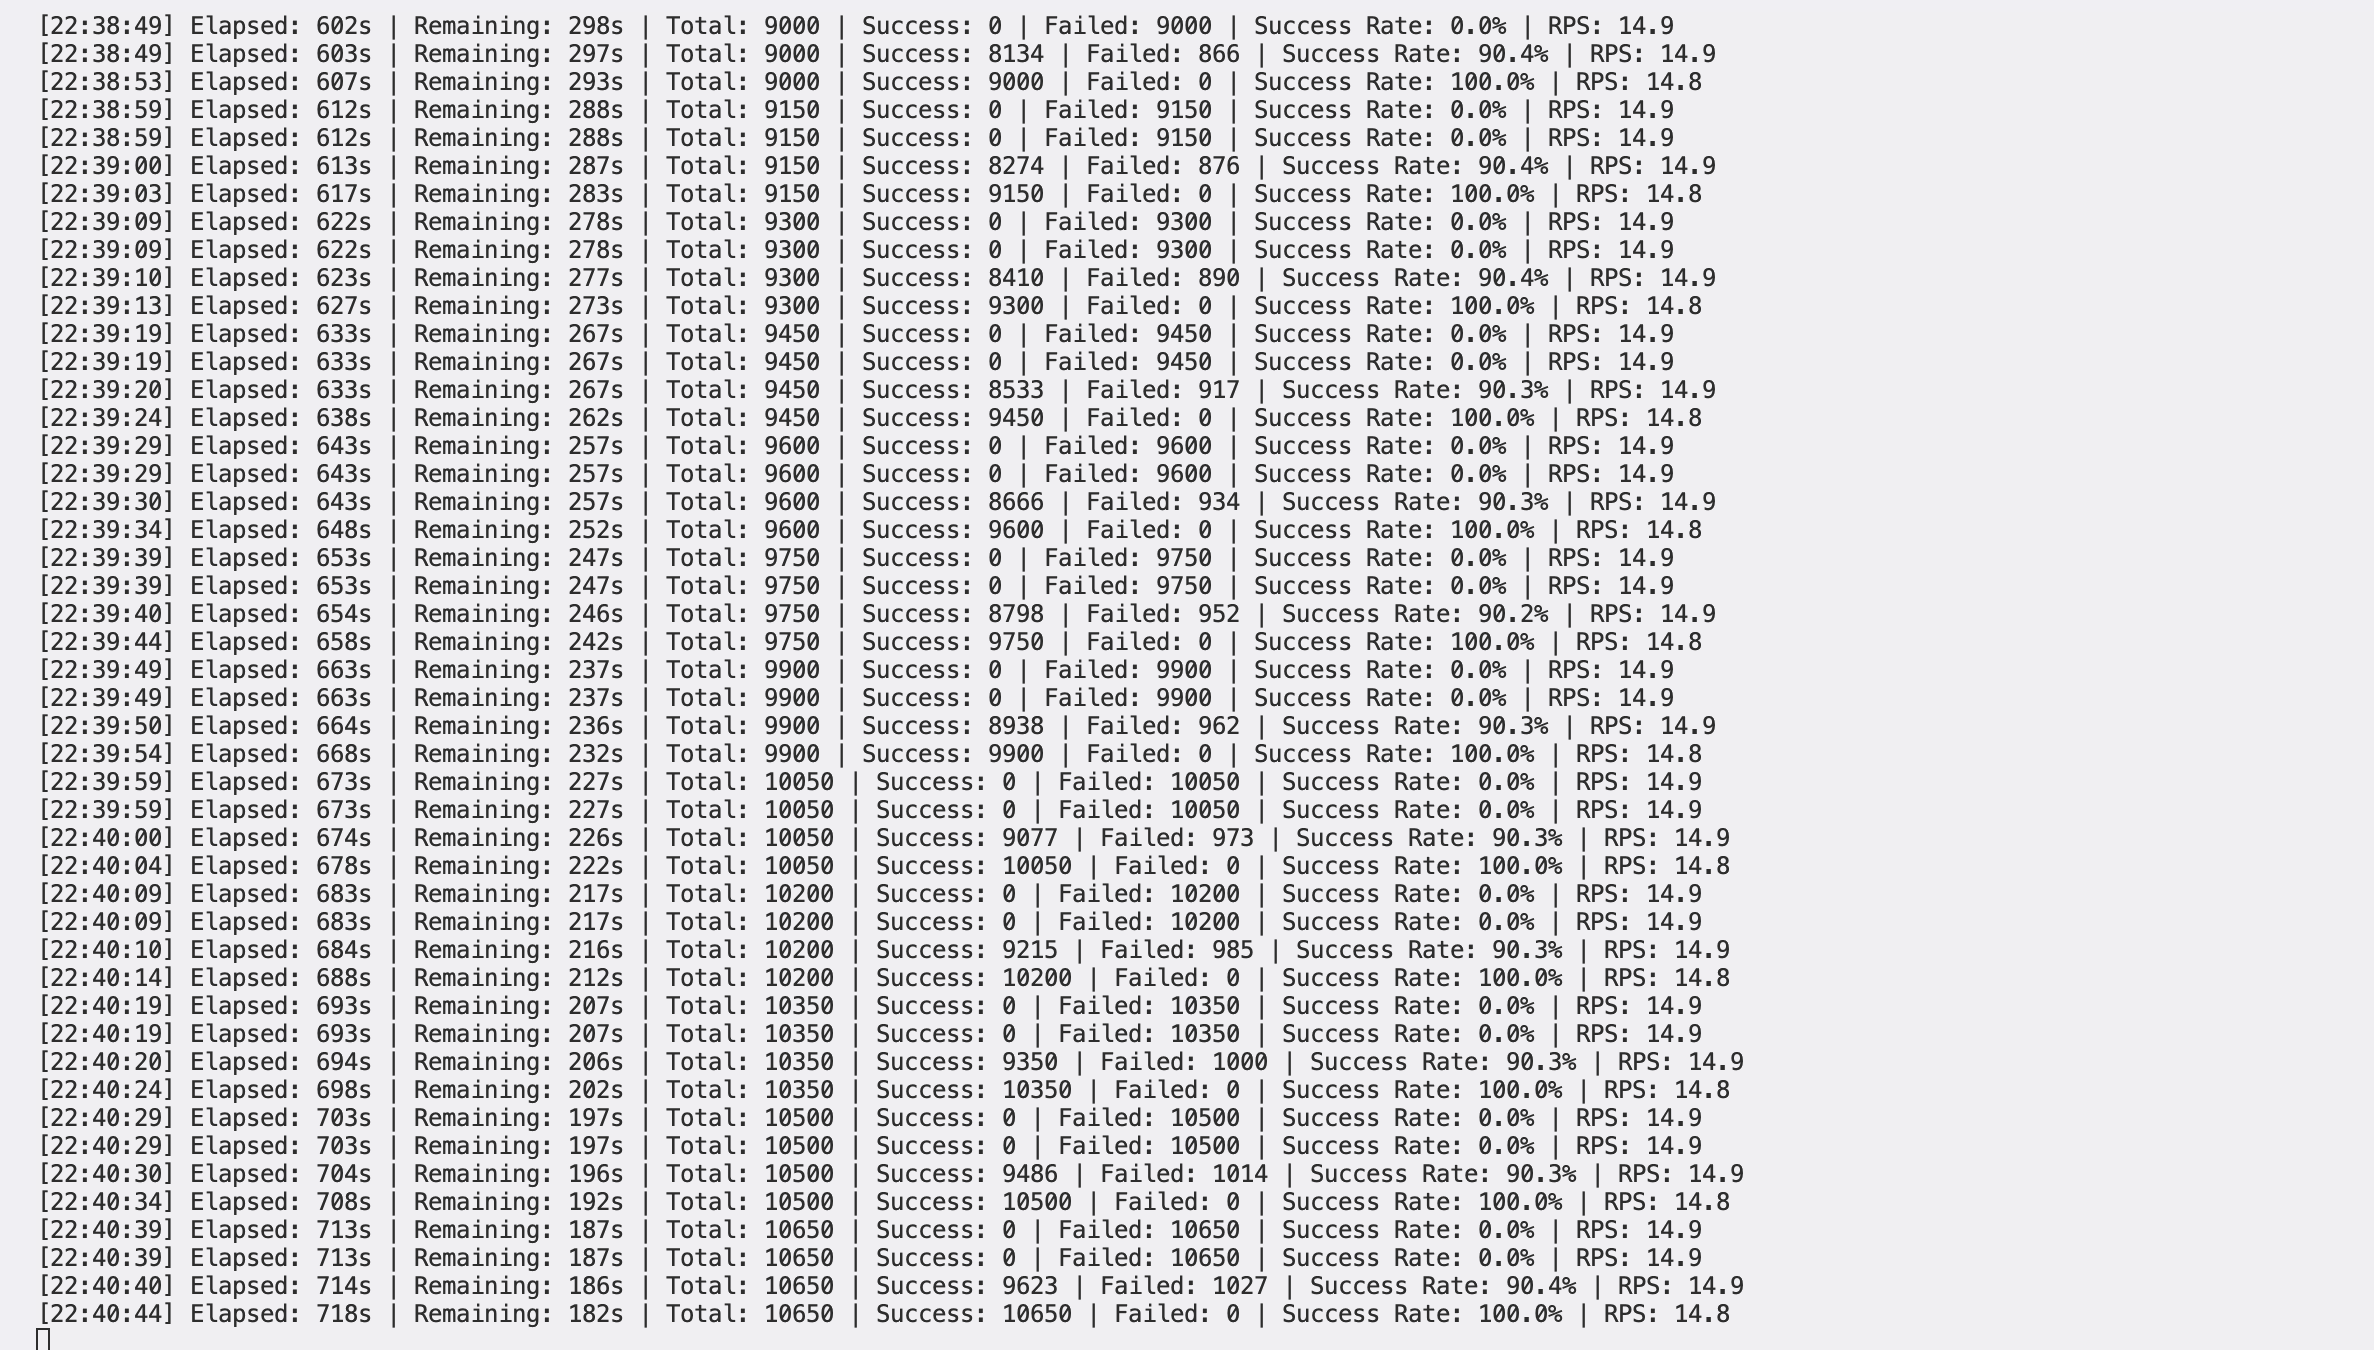
Step 5: Configure AWS DevOps Agent Investigation
Set up AWS DevOps Agent to monitor your EKS cluster and prepare for event investigation workflows.
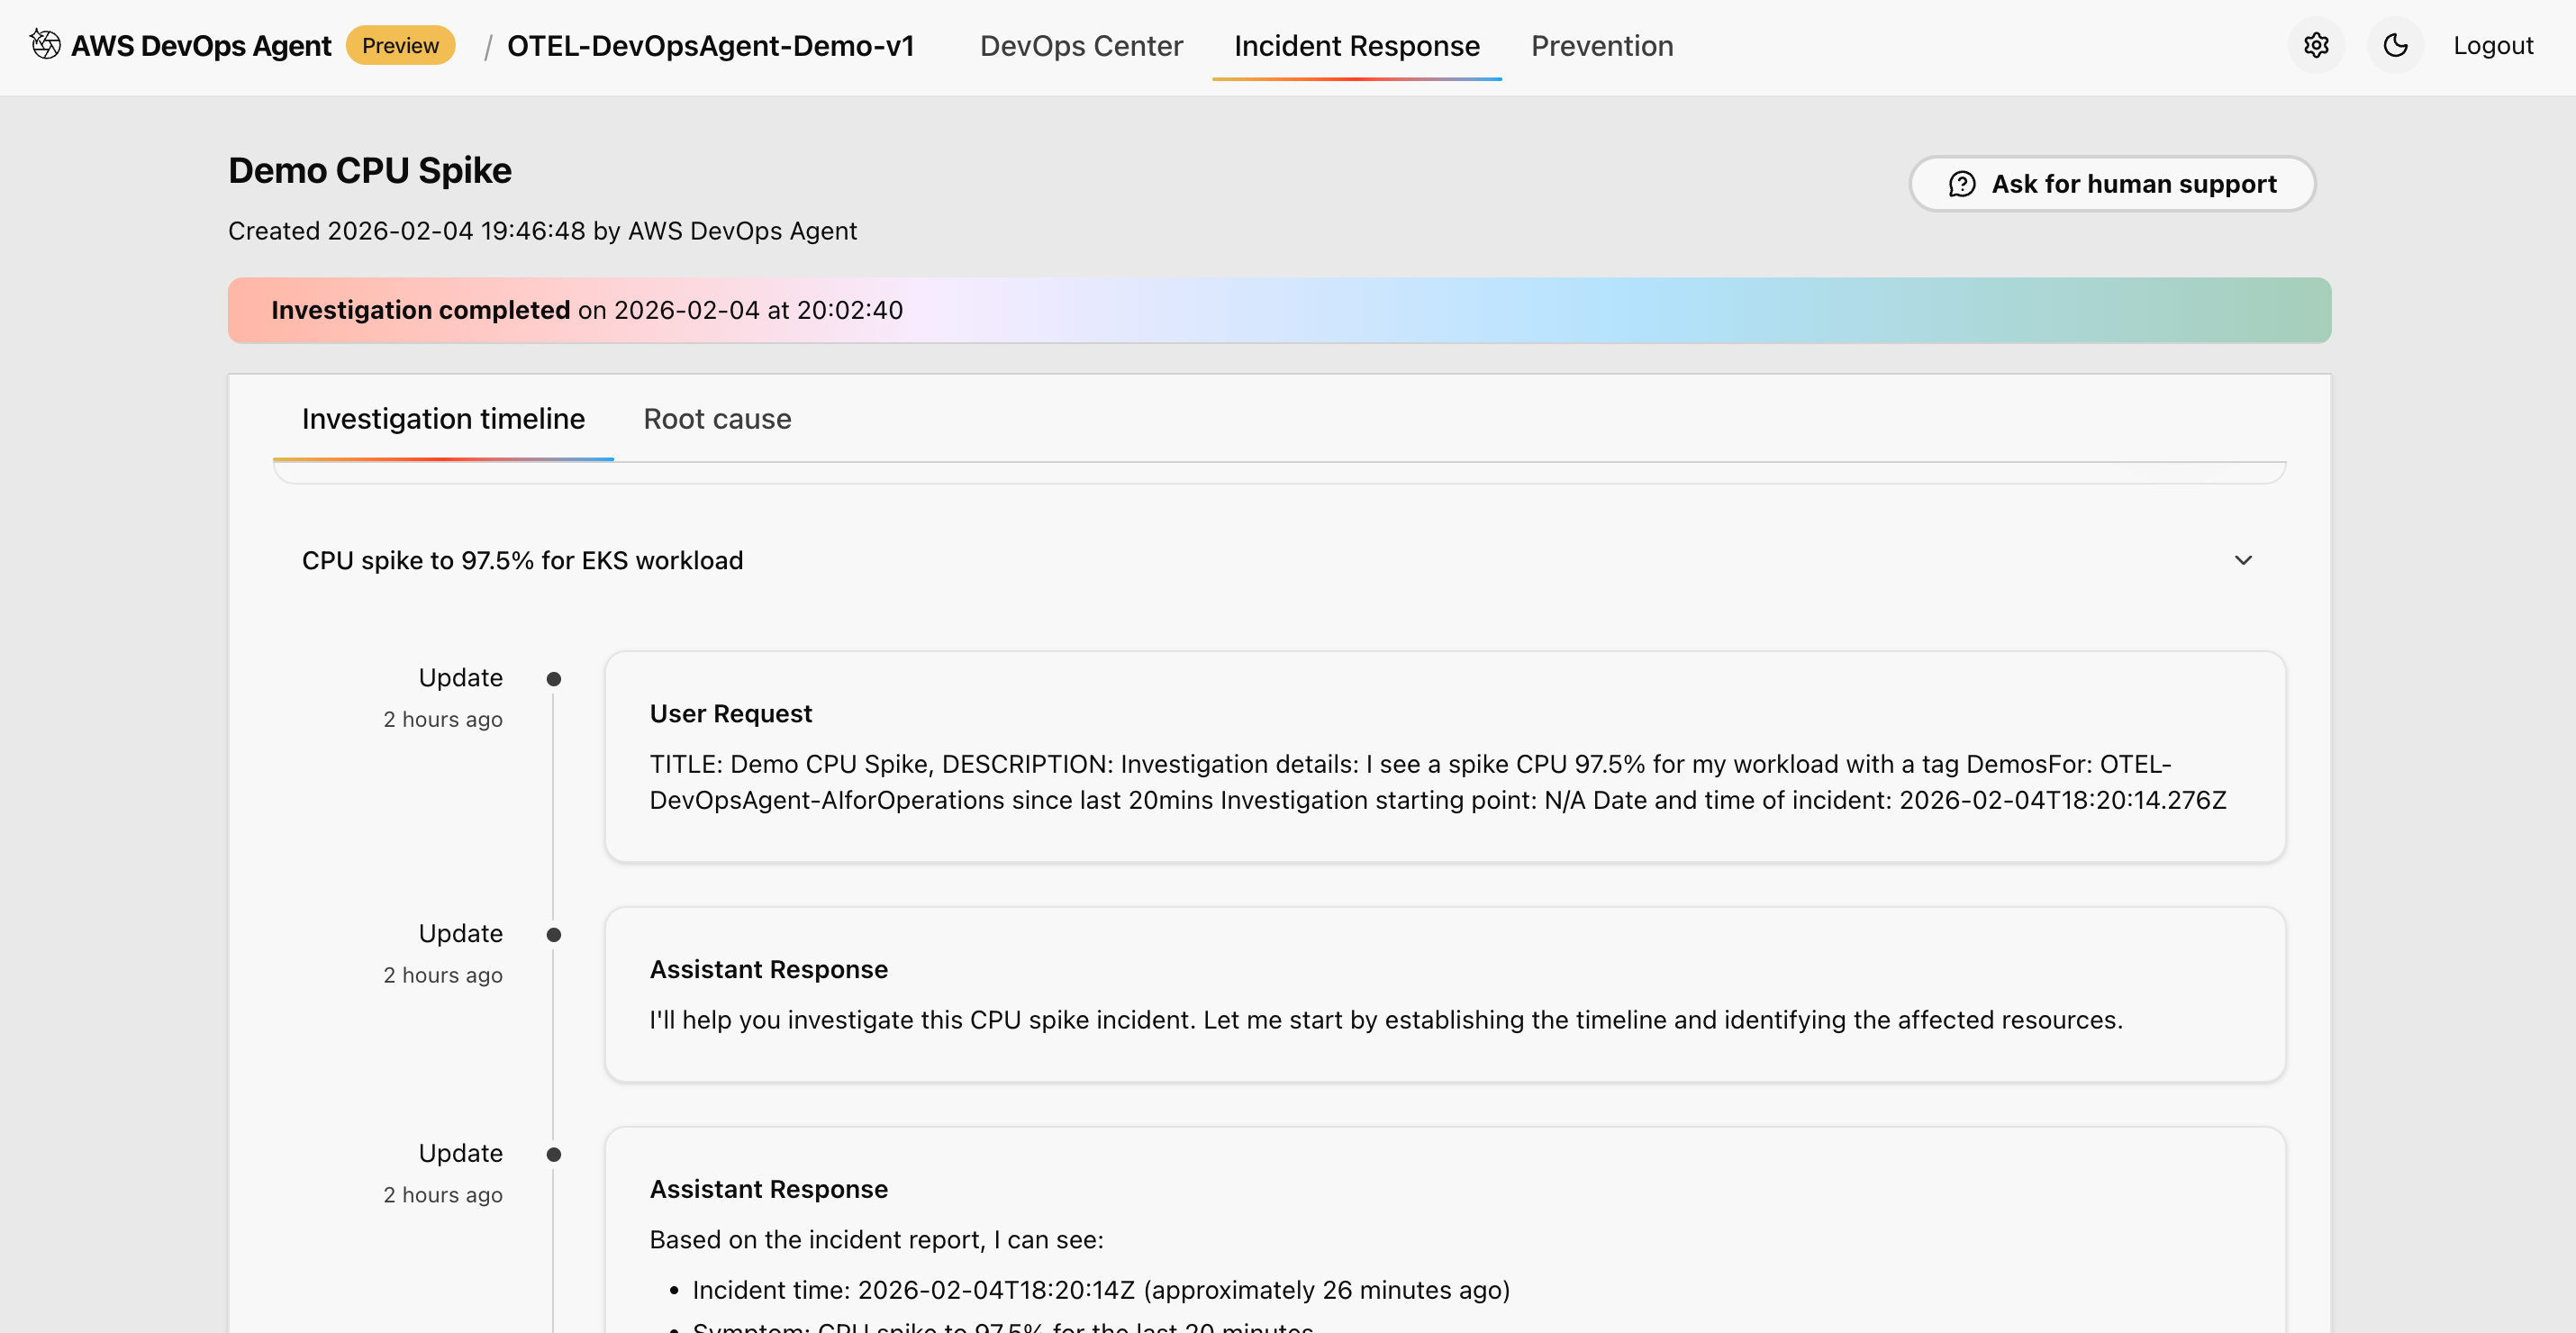 Figure 5: This is screenshot of overall timeline of the ongoing investigation through AWS DevOps agent
Access the AWS DevOps Agent through the AWS Console:
- Navigate to AWS DevOps Agent in the AWS Console.
- Select your configured Agent Space.
- Select Operator access to open the DevOps Agent web application.
- Configure data source connections to verify proper integration.
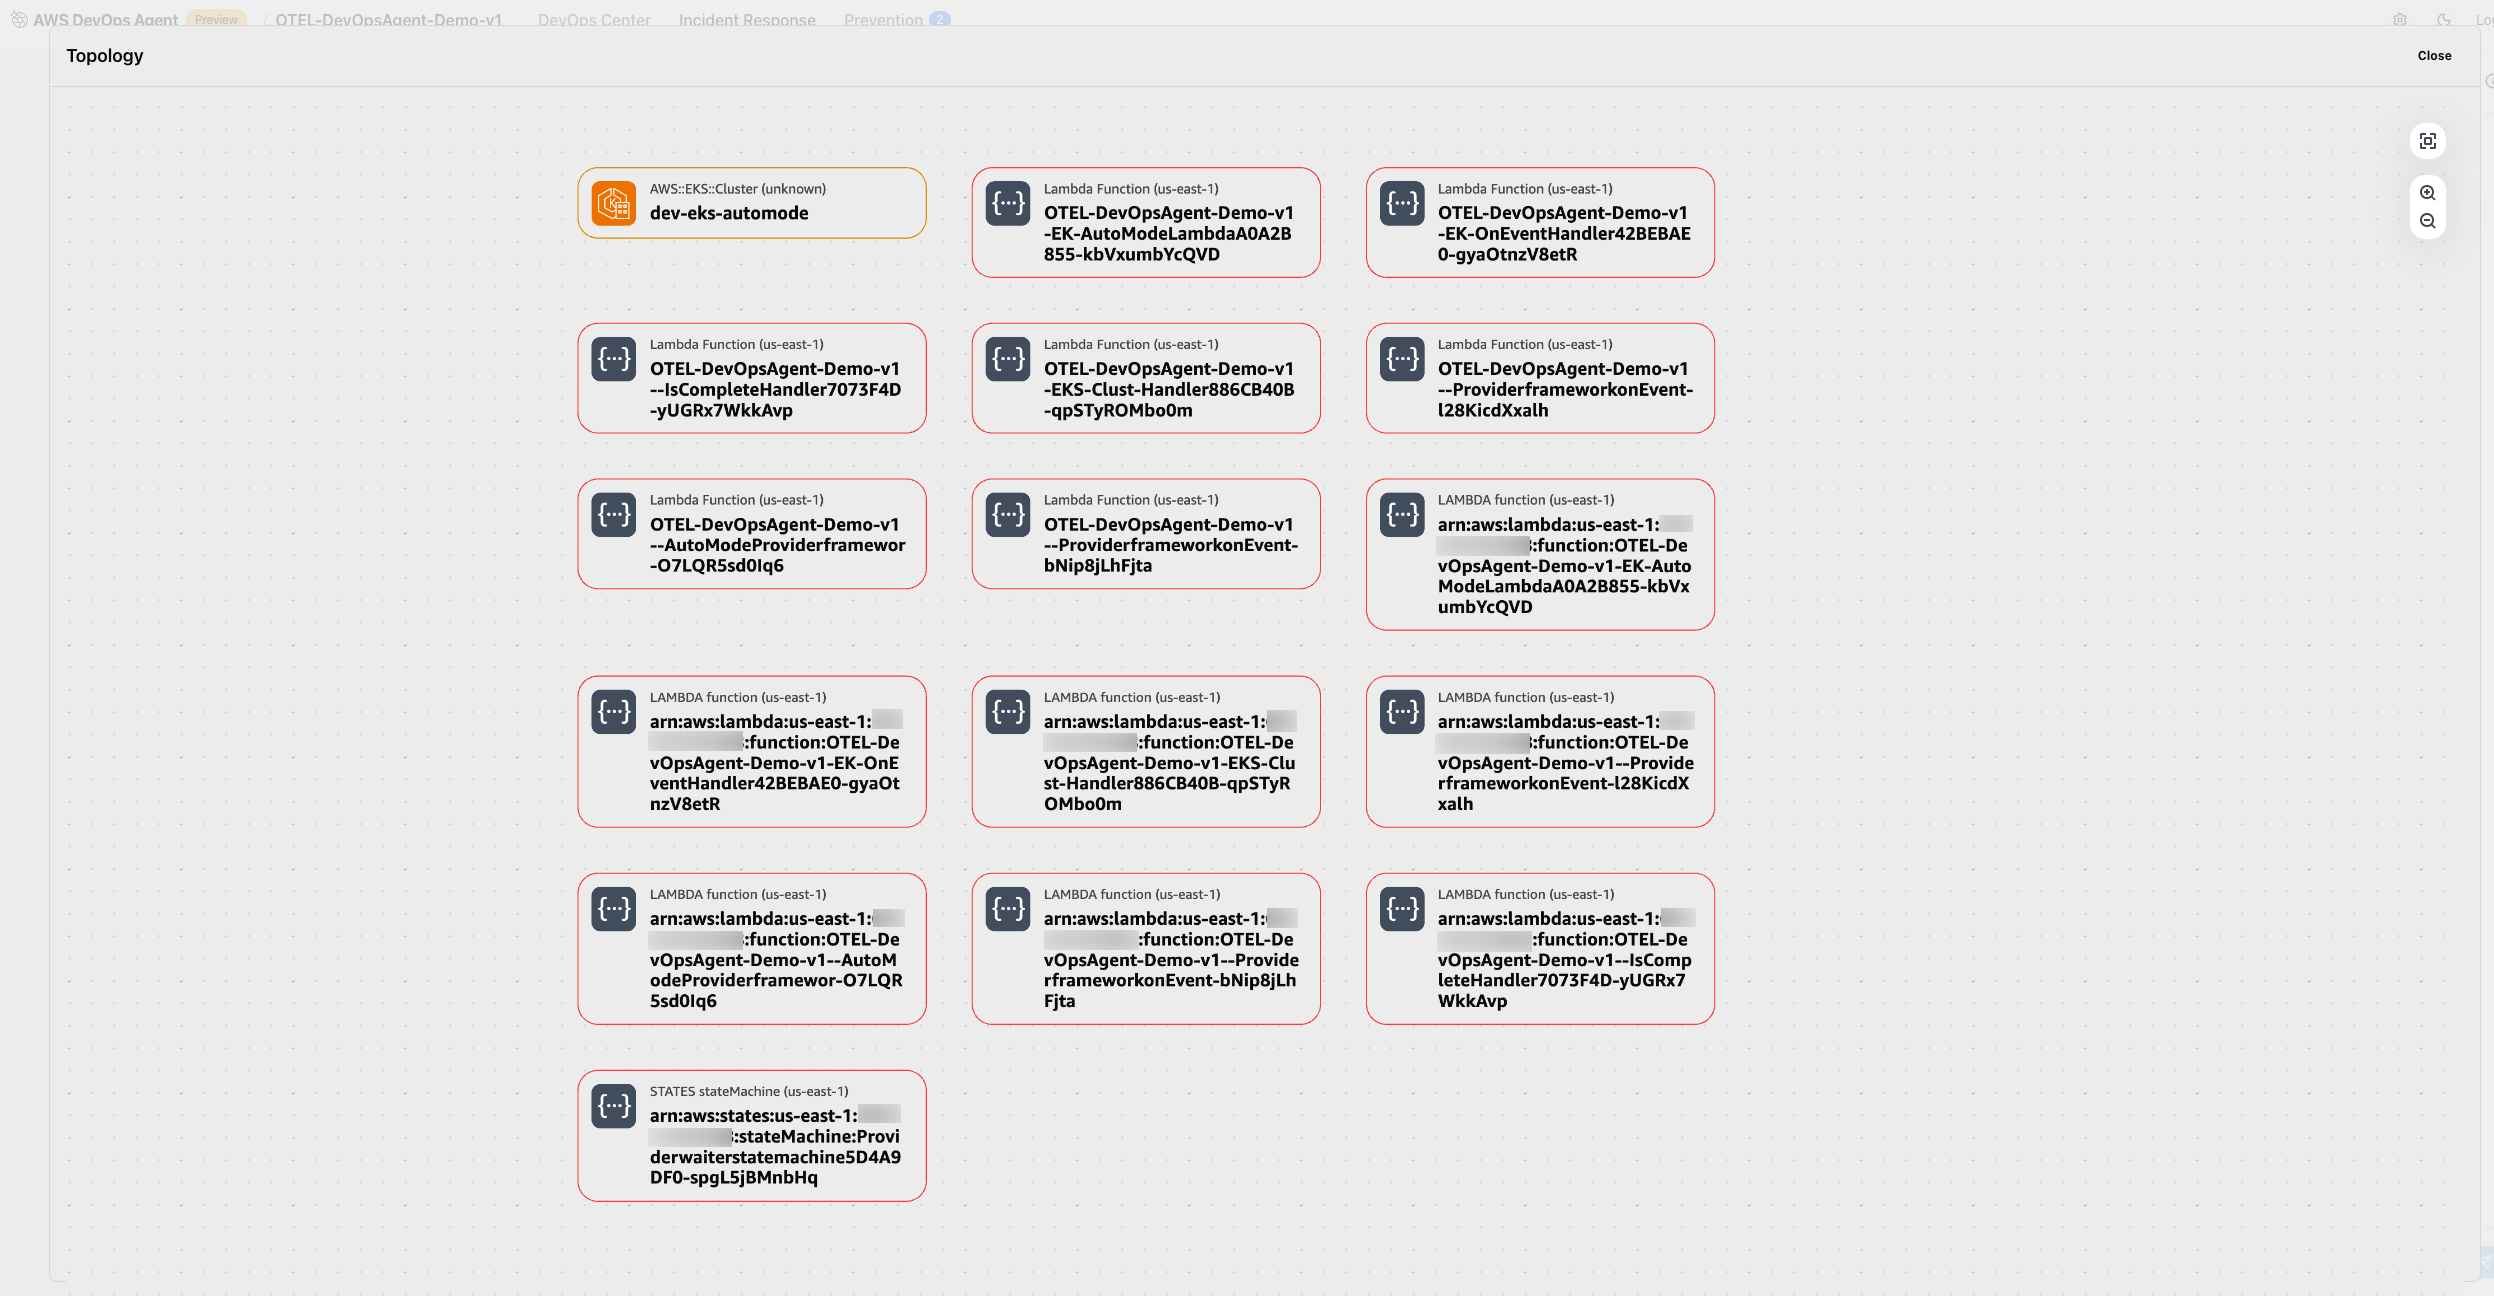 Figure 6: This is screenshot of validating the access to the observability data from the cluster
Verify that the AWS DevOps Agent can access observability data from your cluster including metrics from Amazon Managed Prometheus, logs from Amazon CloudWatch Logs, traces from AWS X-Ray, and topology information from your EKS cluster. DevOps agent can also pull the service map information of your kubernetes resources.
Testing scenarios and use cases
This section demonstrates different testing scenarios that showcase AWS DevOps Agent capabilities in various operational situations.
Scenario 1: Normal load testing
This scenario establishes baseline operational patterns that AWS DevOps Agent can learn from and use for anomaly detection. Generate steady traffic to establish baseline metrics:
python traffic-generator.py --app all --duration 900 --rps 10 --error-rate 0.05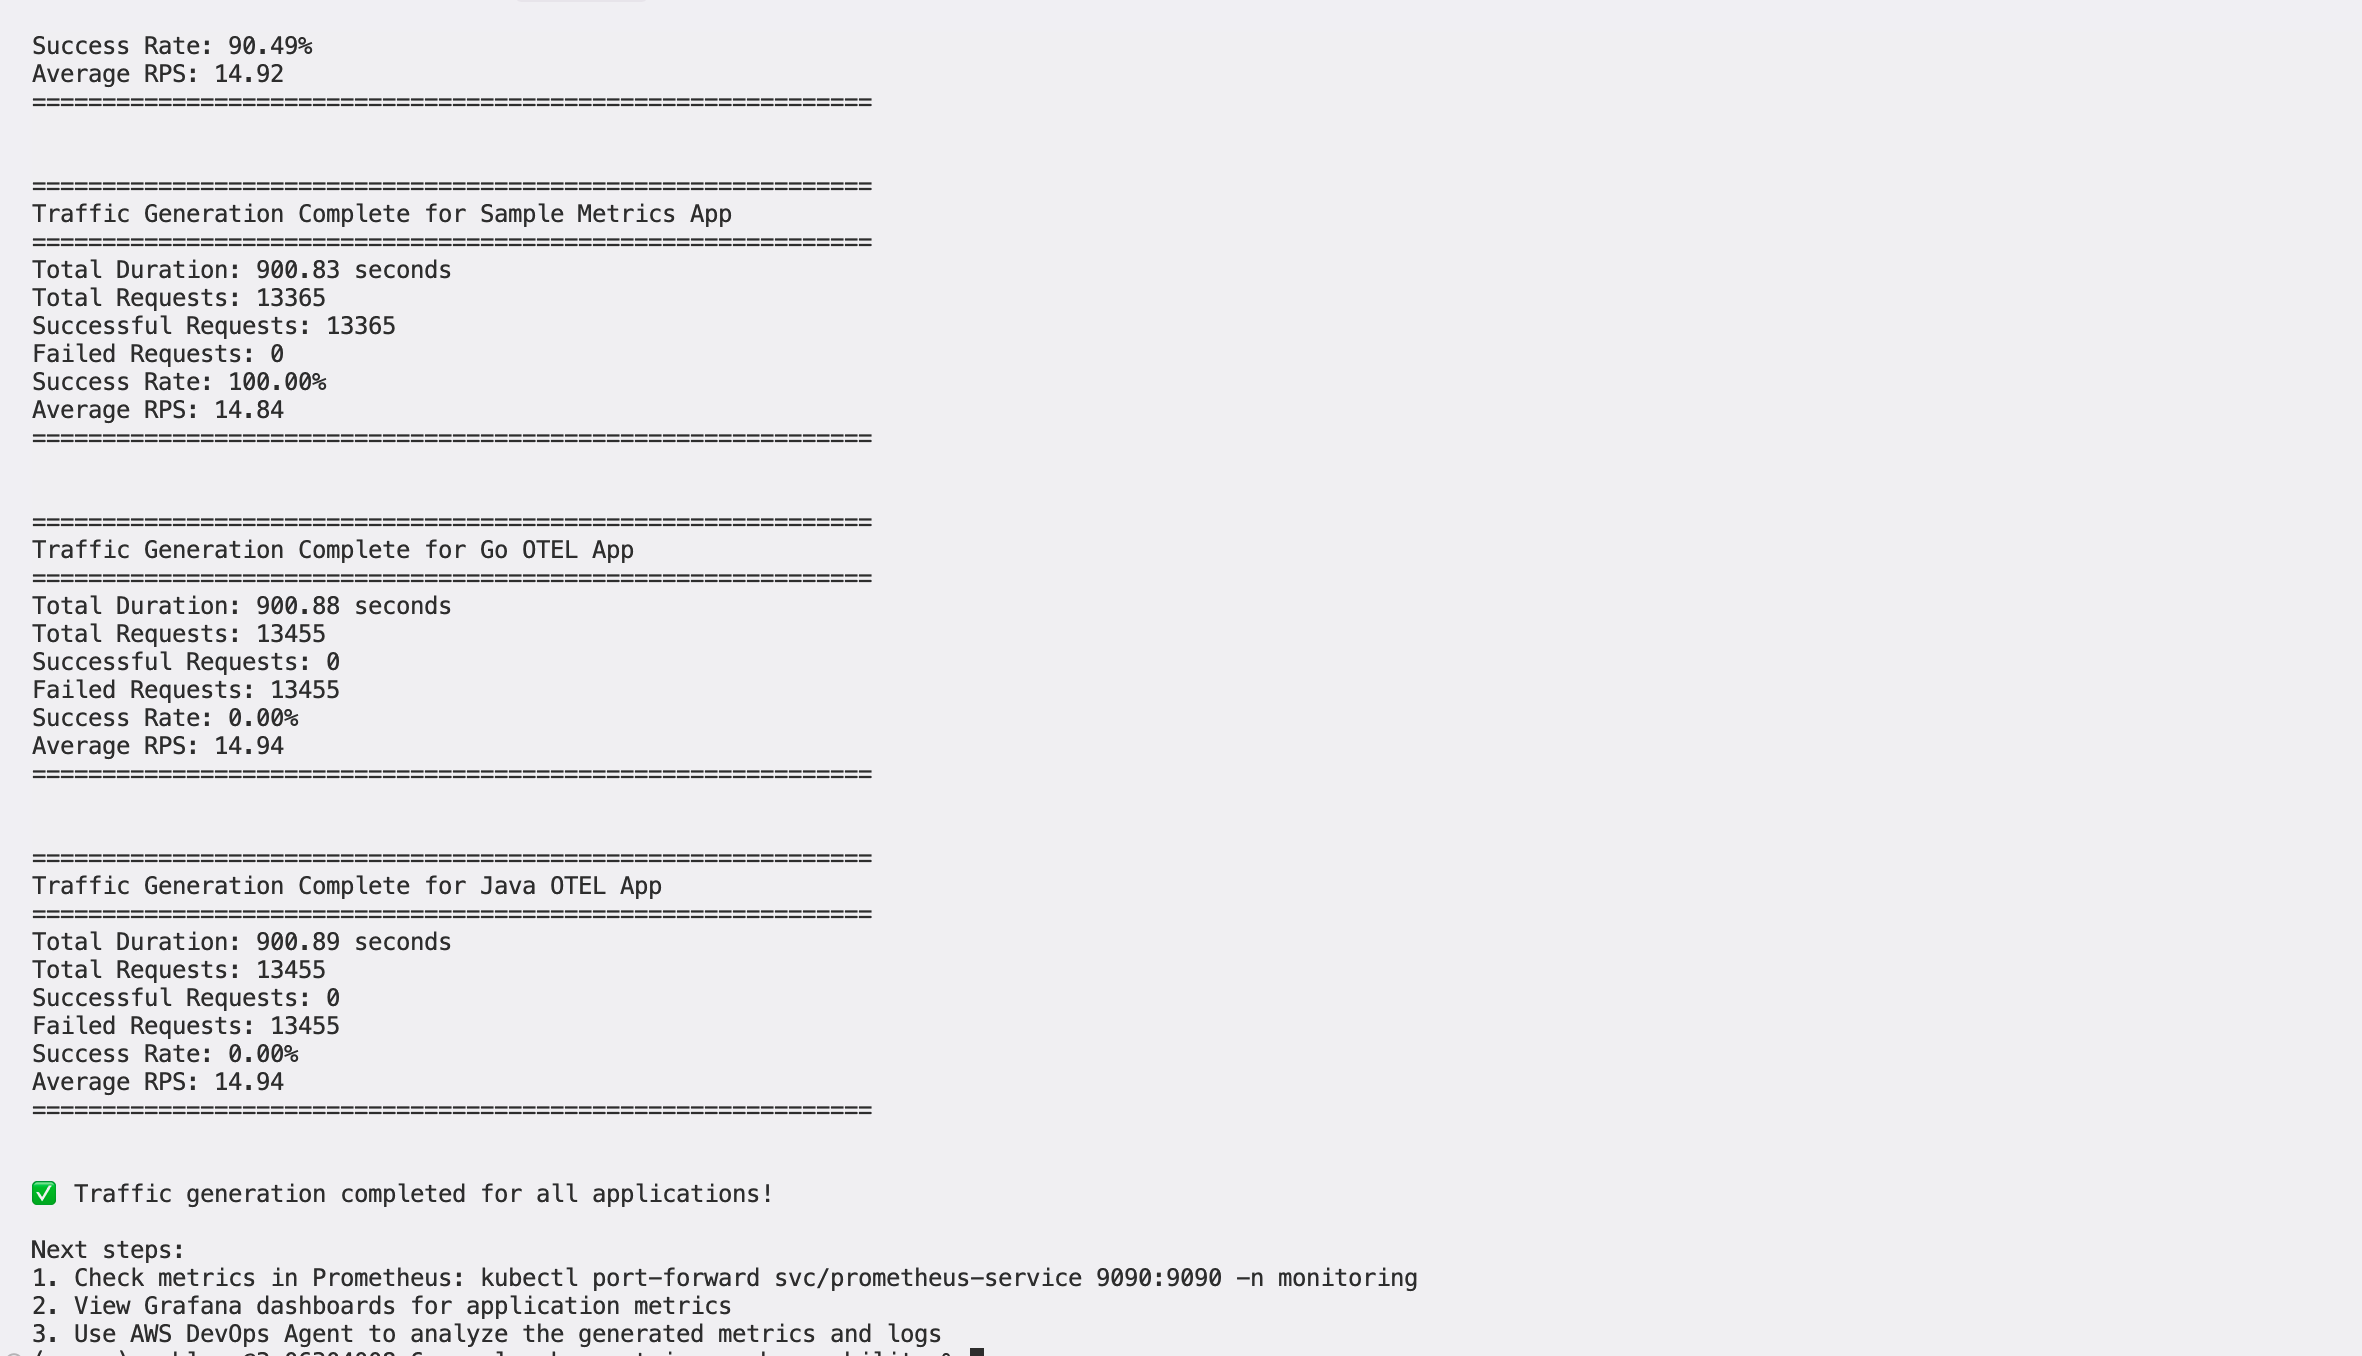 What this test does: The command runs a 15-minute (900-second) steady traffic test across all applications at 10 requests per second, with a 5% simulated error rate. This low, consistent load represents typical production traffic and gives the agent enough signal to establish a reliable operational baseline.
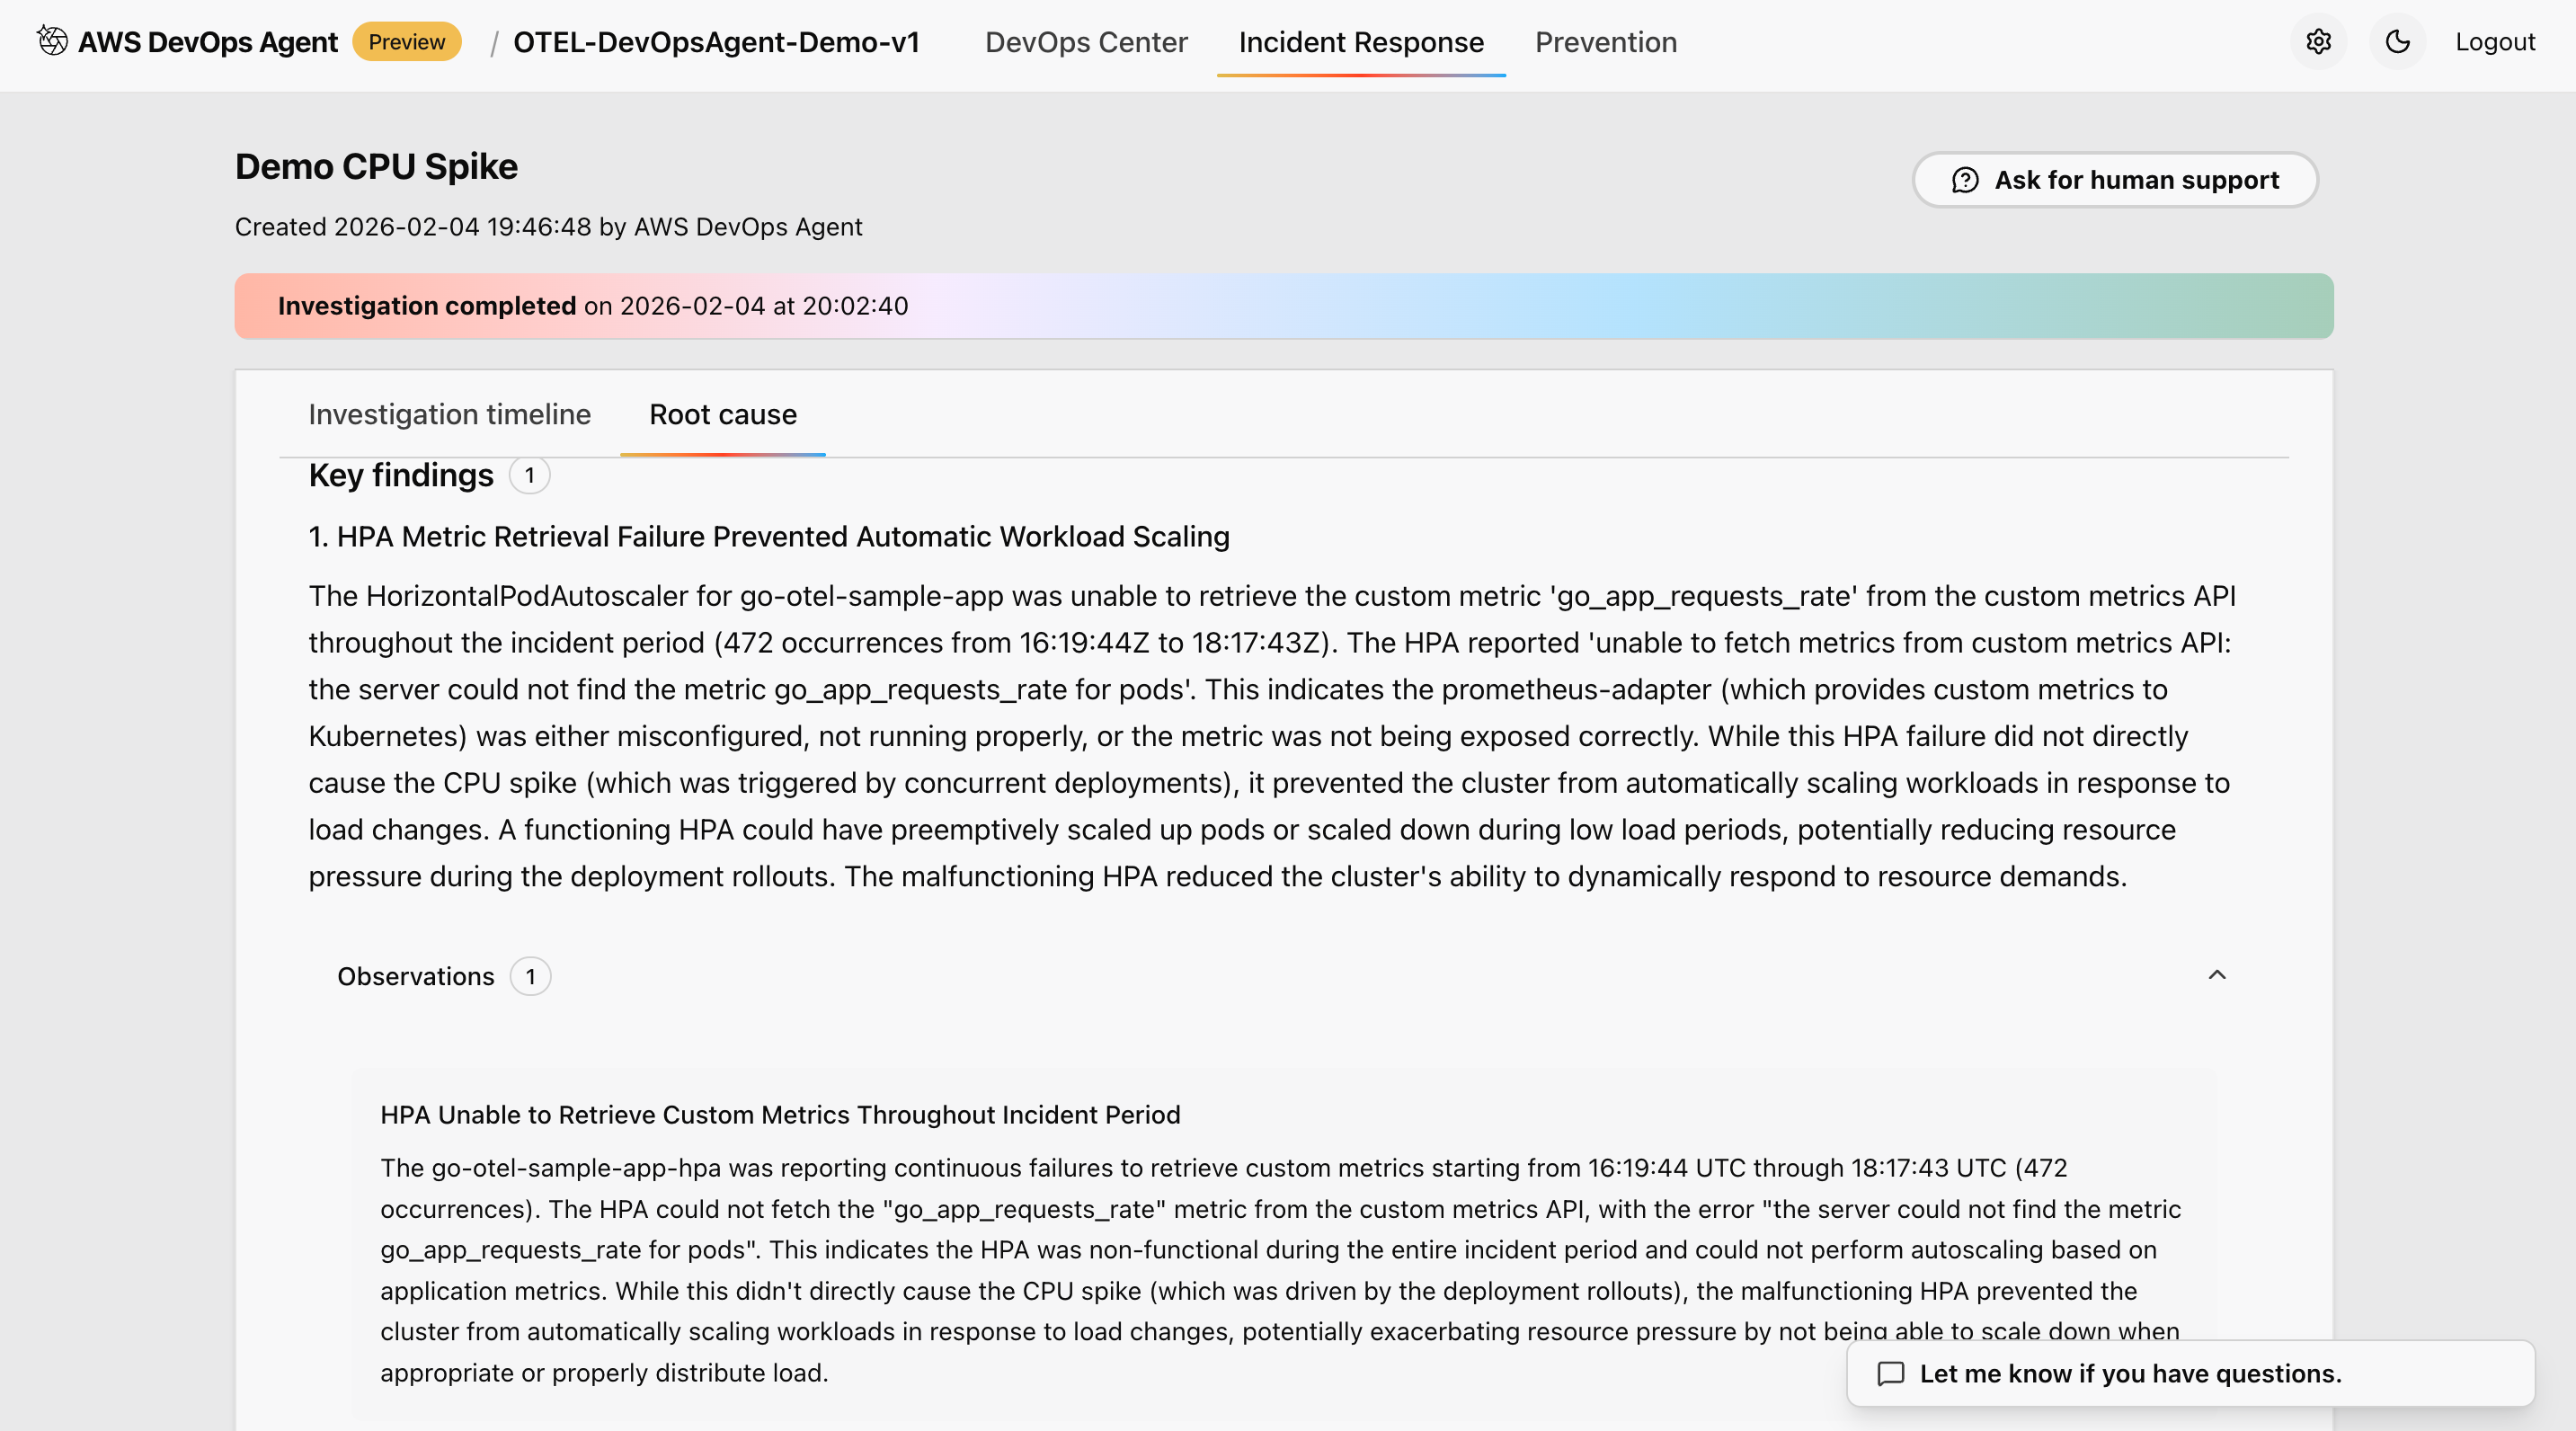 Figure 7: This is screenshot of investigation and root cause found in one of the cluster
What you should observe: During this scenario, the AWS DevOps Agent learns normal operational baselines. In the agent’s investigation dashboard, you will see the following being captured and recorded:
Typical request patterns and response times — The agent records average latency and throughput across all services, establishing what “healthy” looks like for your environment.
Normal error rates and distribution — With a 5% error rate, the agent learns the expected noise floor for errors, so it can distinguish genuine incidents from routine fluctuations.
Resource utilization patterns — CPU, memory, and network usage are tracked per pod and node, giving the agent a reference point for what normal resource consumption looks like under standard load.
Service dependency relationships — The agent maps how services communicate with each other, identifying upstream and downstream dependencies that will be critical for root cause analysis in future incidents.
After the test completes, you should see a stable metrics summary in the agent dashboard showing consistent throughput, low error variance, and steady resource utilization — confirming that a reliable baseline has been captured.
Expected outcomes:
During this scenario, the AWS DevOps Agent learns normal operational baselines. These baselines include typical request patterns and response times, normal error rates and distribution, resource utilization patterns, and service dependency relationships.
Scenario 2: Simulated production event
This scenario demonstrates the AWS DevOps Agent’s ability to investigate and analyze events with elevated error rates and performance degradation:
python traffic-generator.py --app java-otel --duration 600 --rps 30 --error-rate 0.25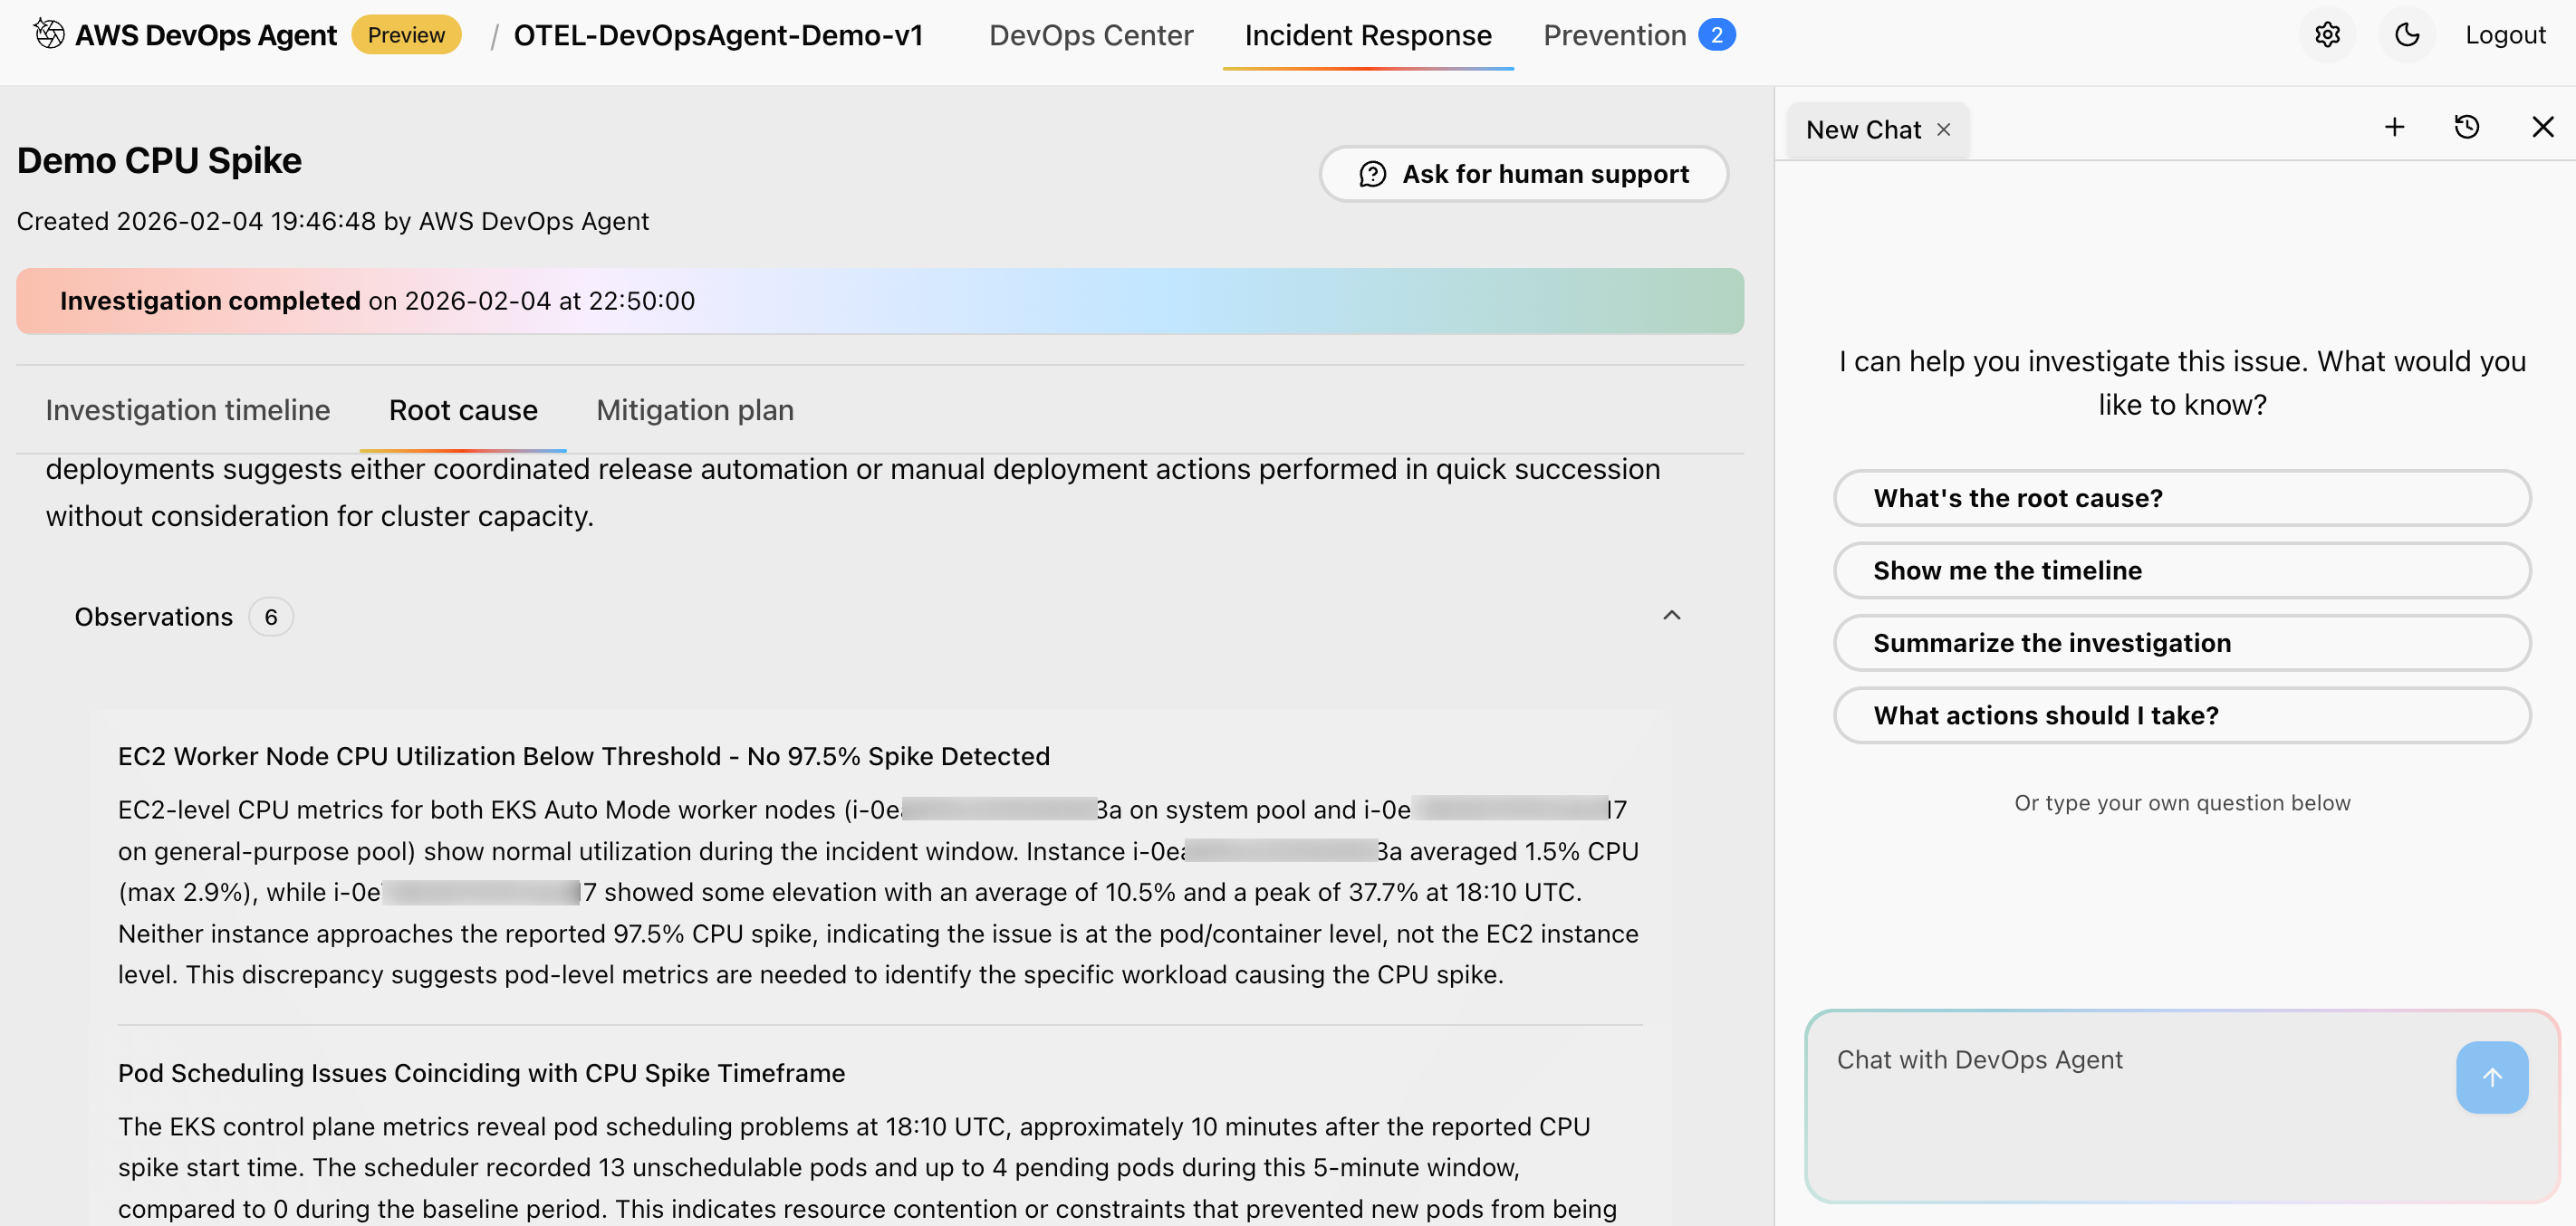 Figure 8: This is screenshot of details of the Nodes and telemetry data which is relevant for the investigations
What this test does: The command targets the java-otel application specifically, running a 10-minute (600-second) high-load test at 30 requests per second — three times the baseline — with a 25% error rate. This simulates a degraded service experiencing both a traffic surge and a significant increase in failures.
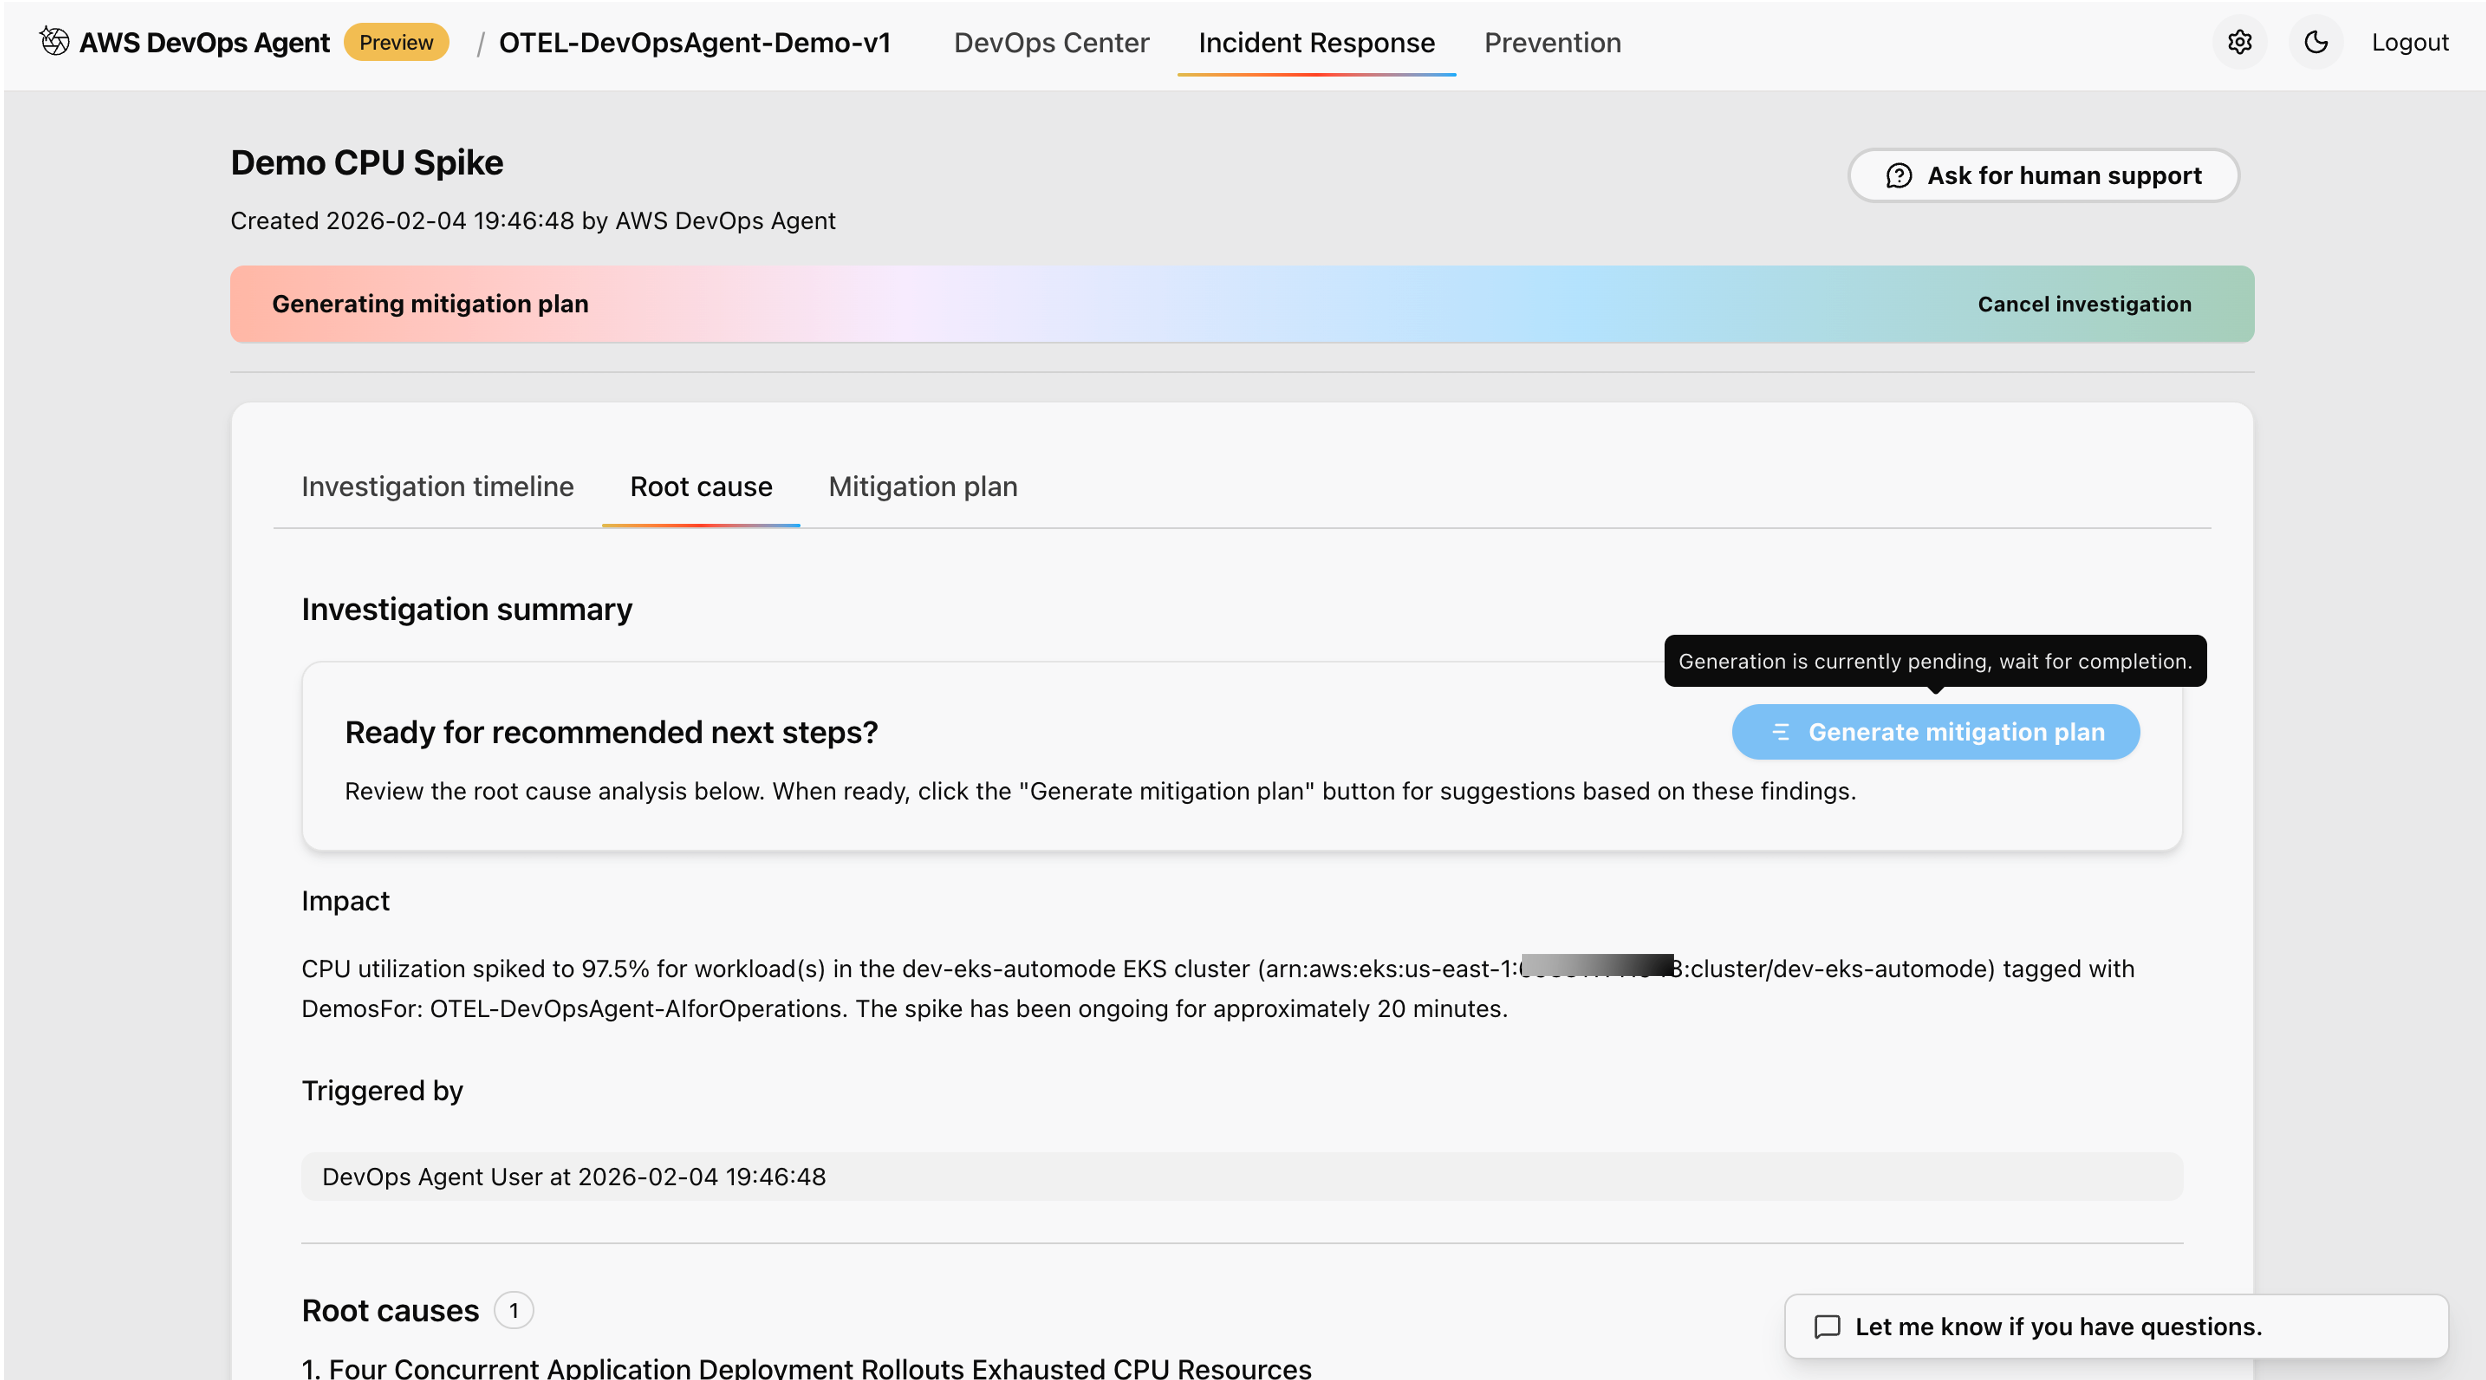 Figure 9: This is screenshot of review and recommended next steps after the analysis of the root cause
What you should observe: Once the test begins, the AWS DevOps Agent detects the deviation from the established baseline and initiates an investigation. In the agent’s incident response view, you will see the following outcomes:
Affected application identification — The agent pinpoints java-otel-app as the impacted service, distinguishing it from other applications running normally in the cluster.
Error pattern analysis — The agent breaks down the 25% error rate into specific failure modes (for example, HTTP 500 errors, timeout spikes, or connection refusals), helping you understand not just that errors are occurring, but why and where.
Resource utilization correlation — The agent correlates CPU and memory spikes on the affected pods with the observed performance degradation, showing a clear relationship between resource exhaustion and increased error rates.
Root cause identification with confidence scoring — The agent presents a ranked list of potential root causes, each with a confidence score, so you can prioritize your investigation. For example, it may identify a memory leak or thread pool exhaustion as the most likely cause with high confidence.
Advanced analysis capabilities: Beyond the immediate incident, the agent performs deeper analysis that you can explore in the investigation timeline view:
Cross-service impact correlation — The agent identifies whether the degradation in java-otel-app has cascading effects on dependent services, showing you the full blast radius of the incident.
Timeline reconstruction — The agent reconstructs the sequence of events leading up to and during the incident, helping you understand how the situation evolved over time.
Dependency mapping — Upstream and downstream service dependencies are visualized, making it clear which services are affected directly and which are at risk.
Prioritized remediation recommendations — The agent provides actionable remediation steps ranked by business impact, so your team can address the most critical issues first. Recommendations may include scaling the affected deployment, adjusting resource limits, or rolling back a recent configuration change.
After the test completes, you should see a full incident report in the agent dashboard summarizing the root cause, affected components, timeline, and recommended next steps — giving your team everything needed to resolve the issue and prevent recurrence.
Expected outcomes:
The agent identifies which application is affected (java-otel-app), analyzes error patterns and rates for specific failure modes, correlates resource utilization with performance degradation, and provides potential root causes with confidence scoring.
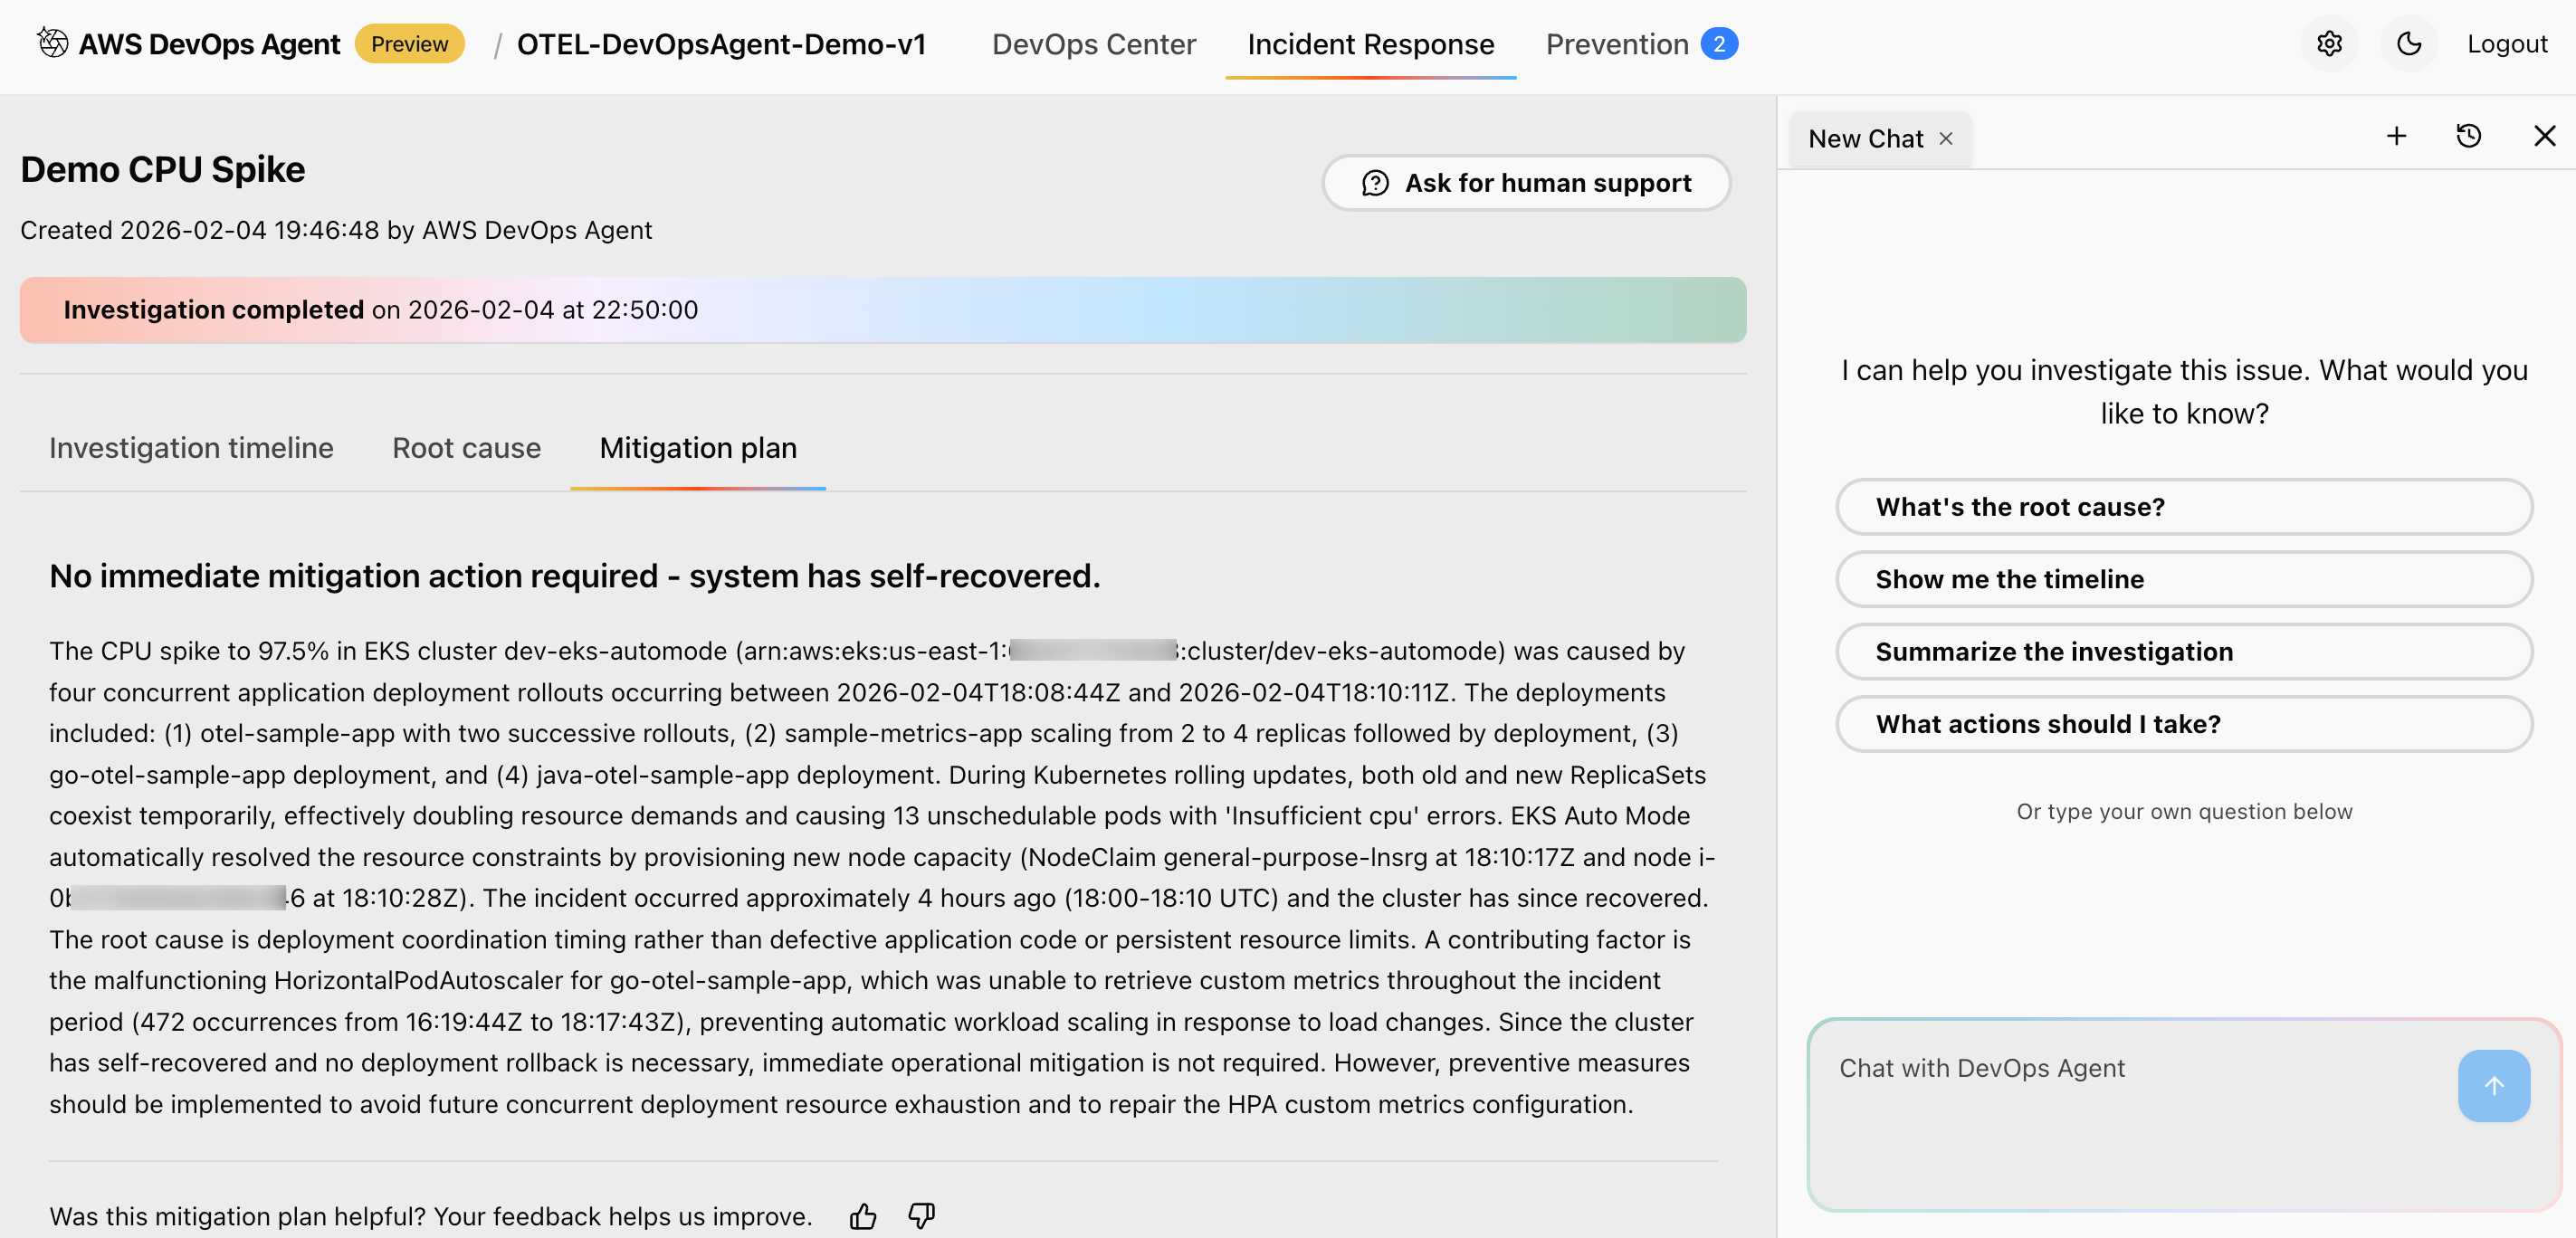 Figure 10: This is screenshot of mitigation plan suggested by the AWS DevOps agent
Advanced analysis capabilities:
The agent performs analysis including cross-service impact correlation, timeline reconstruction of event progression, dependency mapping to identify upstream/downstream effects, and prioritized remediation recommendations based on business impact.
AWS DevOps Agent Investigation workflow
This section details how to use AWS DevOps Agent for event investigation and analysis.
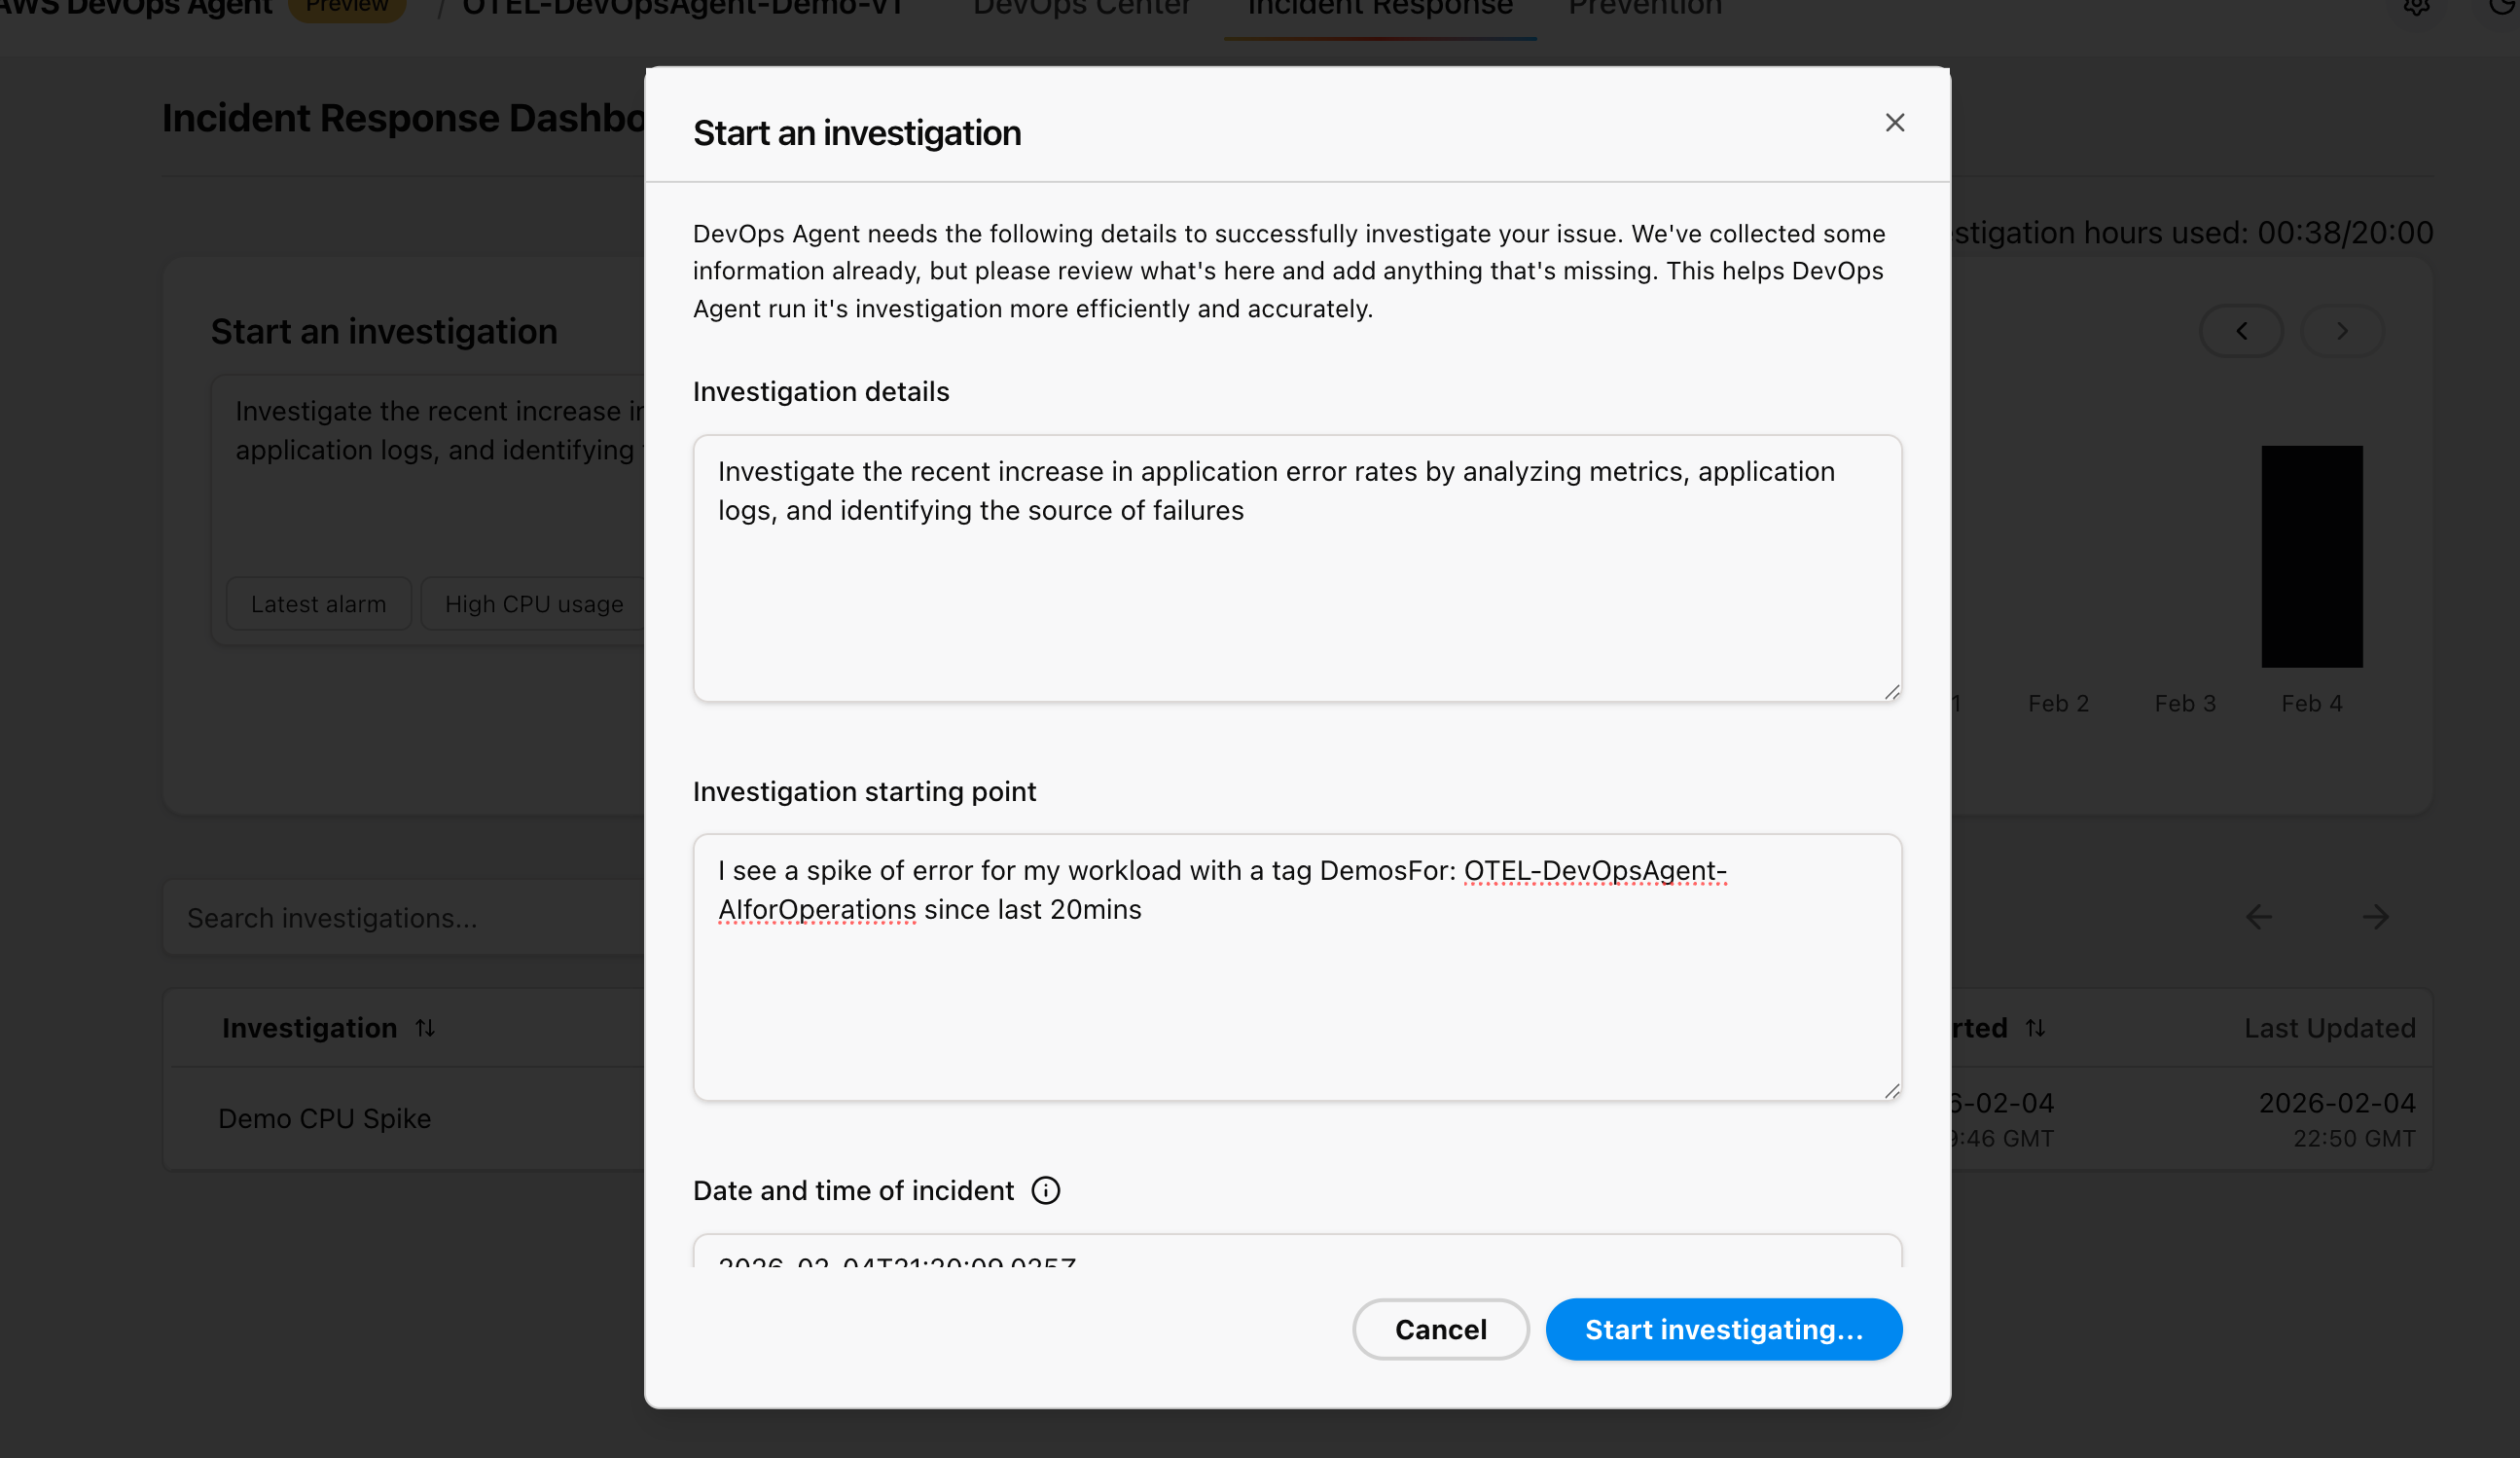 Figure 11: This is screenshot of starting an investigation from the AWS Console inside AWS DevOps agent service
Starting an investigation
Access the AWS DevOps Agent web interface and initiate a new investigation:
- Investigation Trigger: Choose from predefined scenarios like “High CPU usage,” “Error rate spike,” or “Performance degradation”
- Time Range Selection: Select the time period when you generated traffic or observed issues.
- Scope Definition: Provide the AWS Account ID, AWS Region (us-east-1), and specific cluster or application context.
- Data Source Configuration: Make sure all observability data sources are properly connected.
Investigation Process
AWS DevOps Agent follows a systematic investigation methodology:
Data Collection Phase:
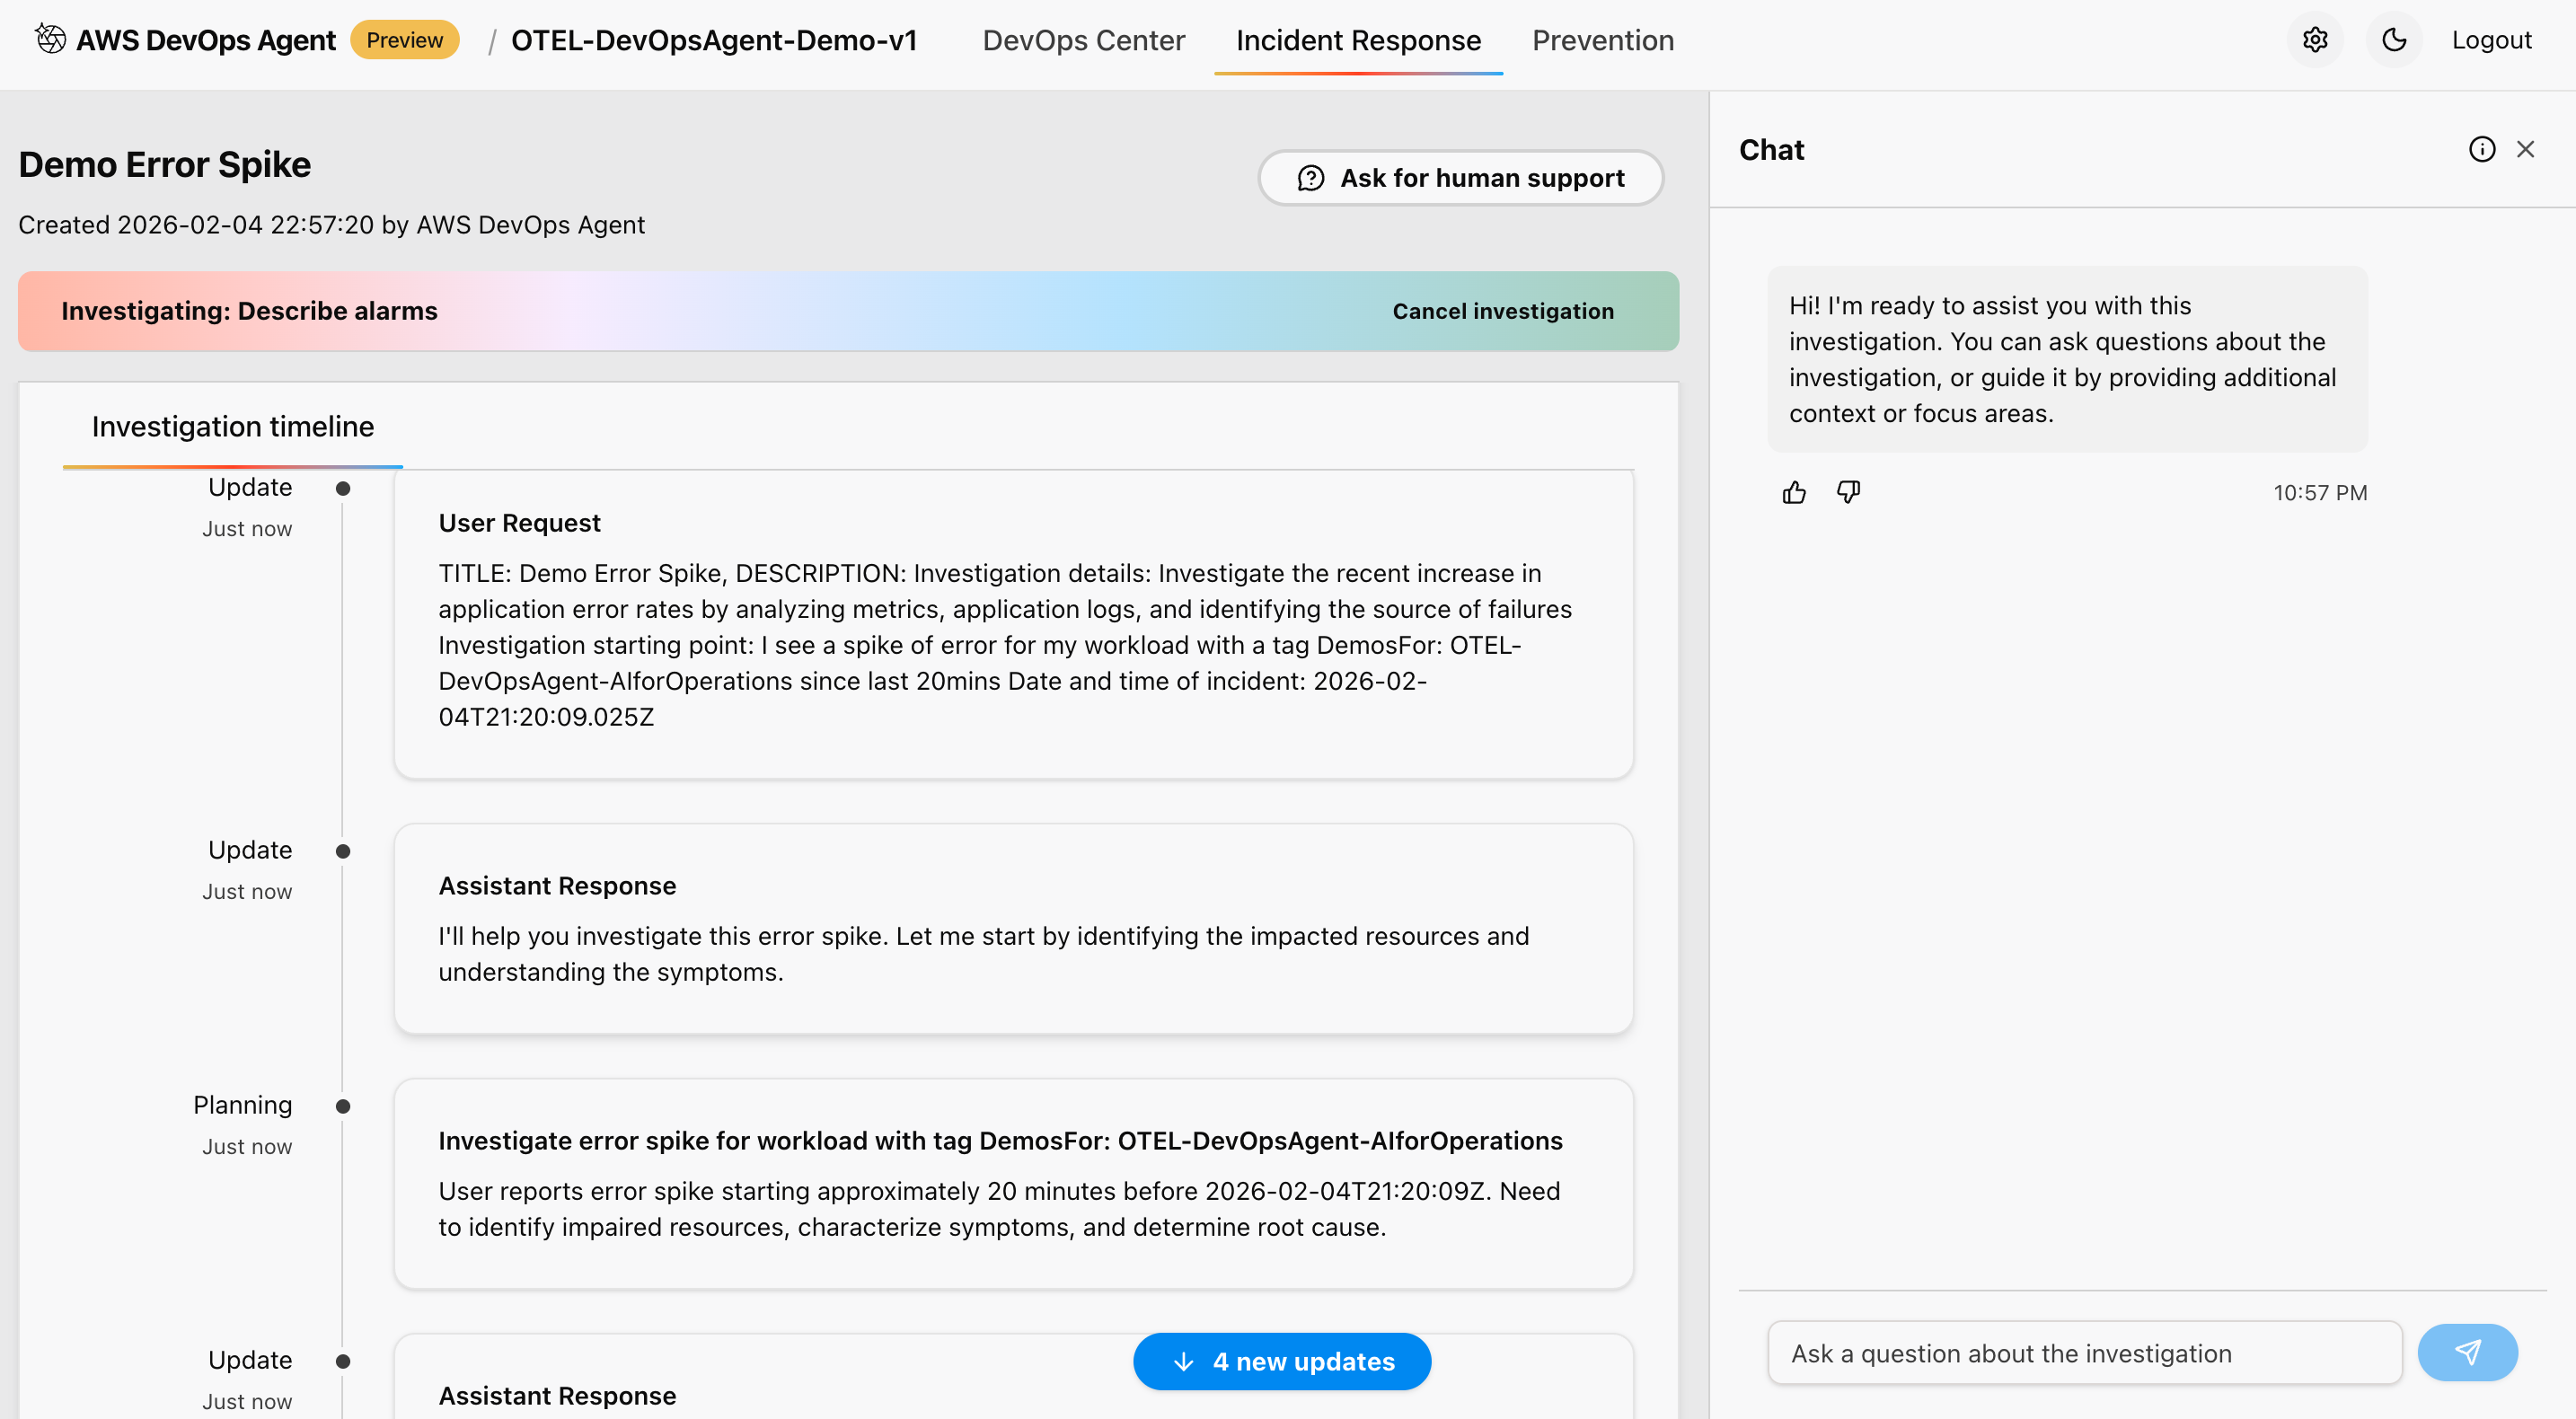 Figure 12: This is screenshot of investigation timeline done by the AWS DevOps agent
This approach correlates metrics from Amazon Managed Prometheus workspace, and analyzes logs from Amazon CloudWatch Logs for error patterns and anomalies. It also reviews distributed traces from AWS X-Ray for service dependencies, and examines application topology and service relationships to provide comprehensive observability during the migration process.
Analysis phase:
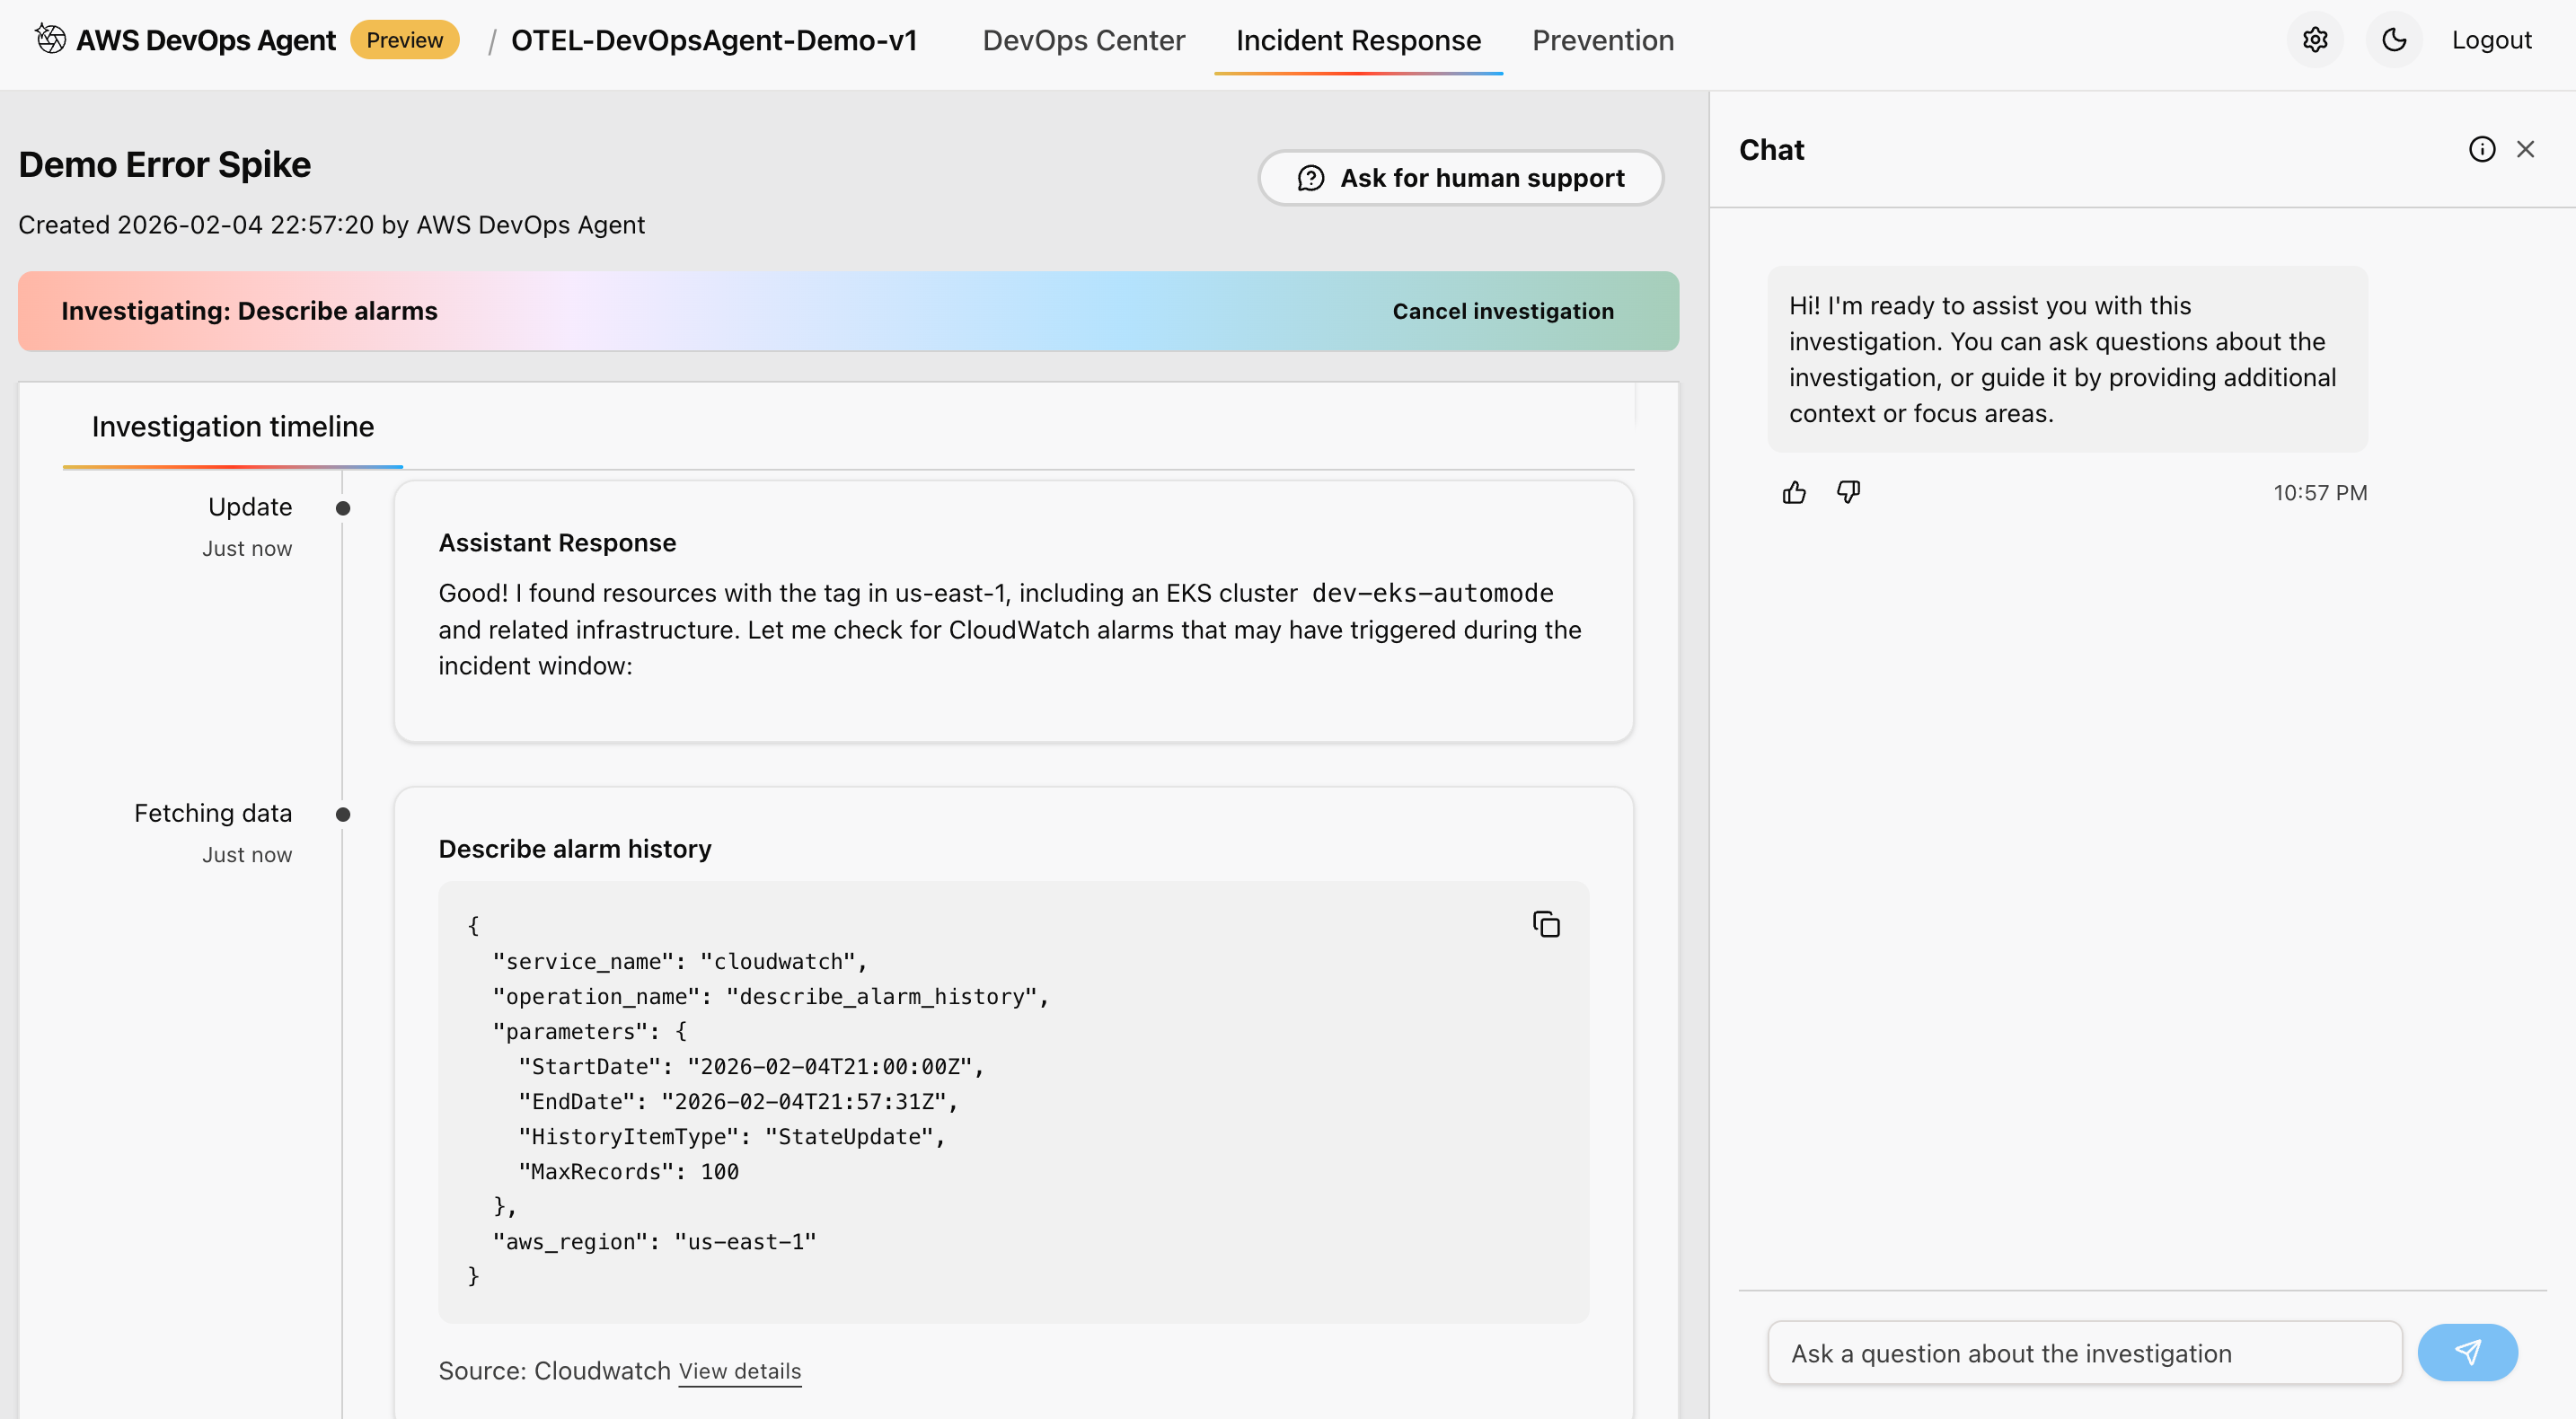 Figure 13: This is screenshot of analysis done from the AWS Console inside AWS DevOps agent service
This approach identifies patterns and anomalies using MLalgorithms. It correlates events across multiple data sources for comprehensive understanding, applies statistical analysis to determine the significance of observed changes, and compares current behavior against established baselines for accurate detection and assessment of system behavior.
Root cause identification:
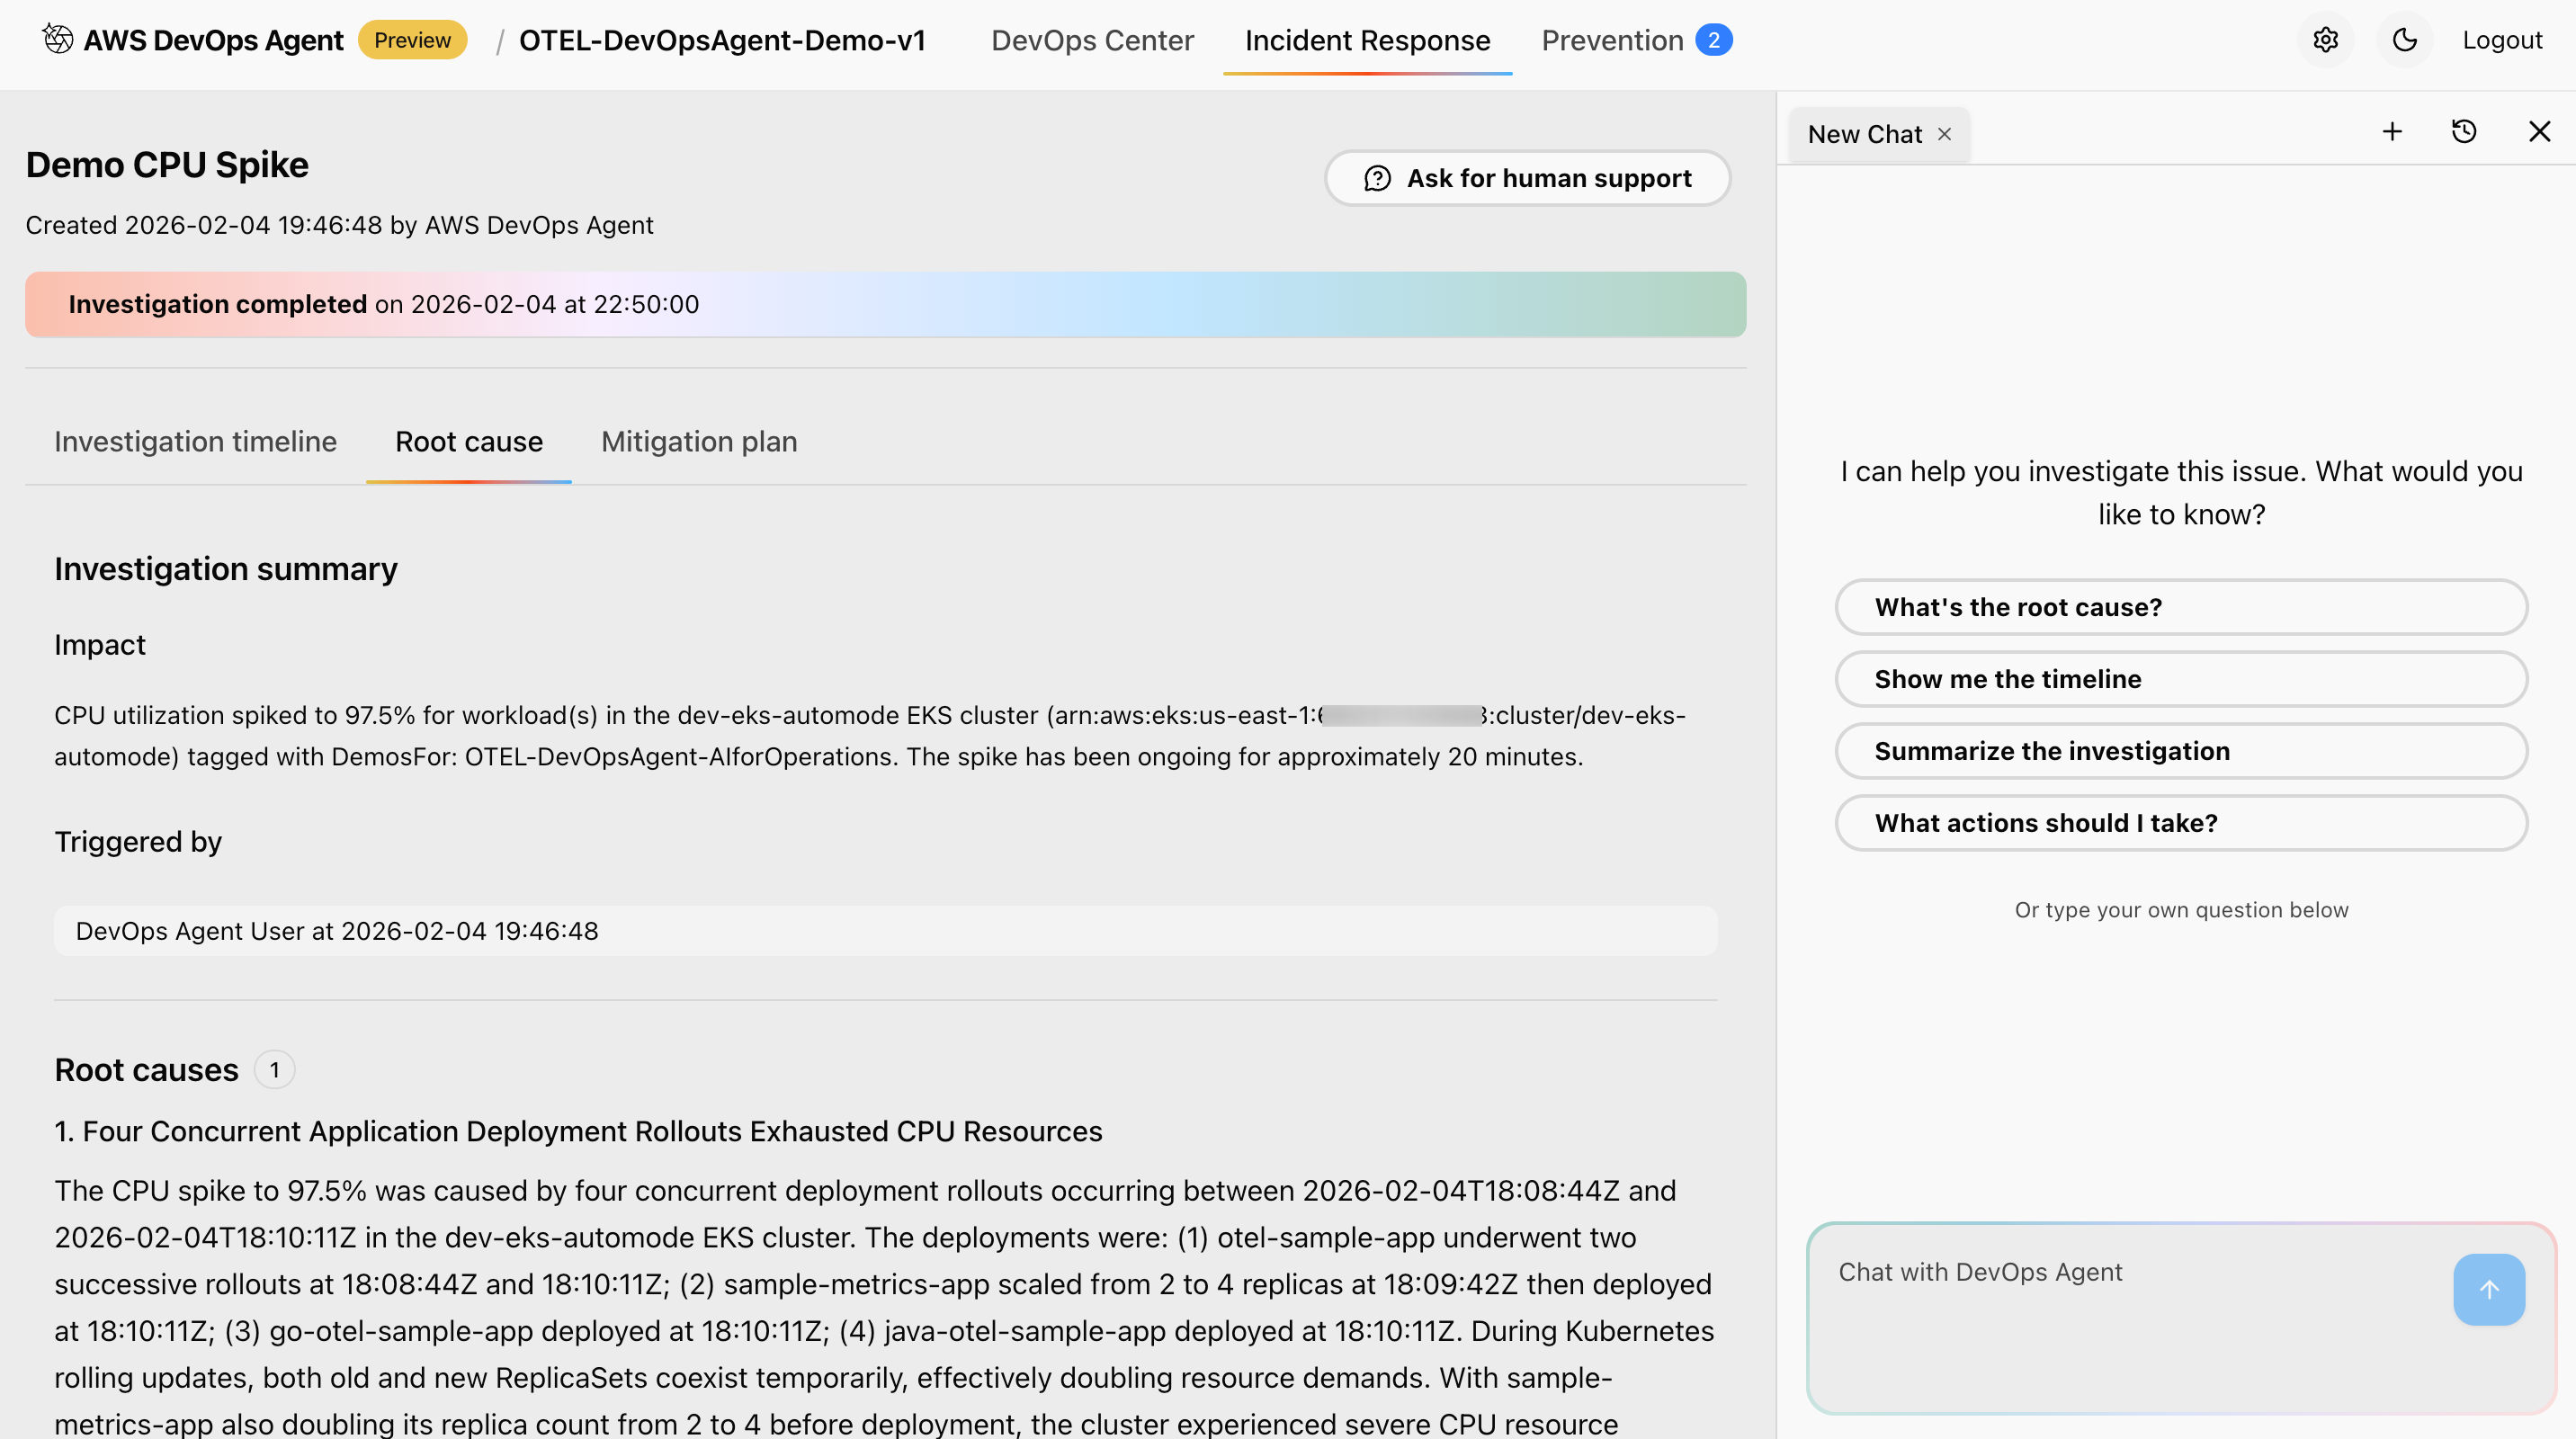 Figure 14: This is screenshot of root cause and investigation summary done from the AWS Console inside AWS DevOps agent service
This approach provides systematic root cause analysis with confidence scoring, identifies contributing factors and potential trigger events, maps event timeline with correlated evidence from multiple sources, and suggests most likely causes based on data correlation and pattern analysis to enable efficient troubleshooting and resolution.
Mitigation strategy:
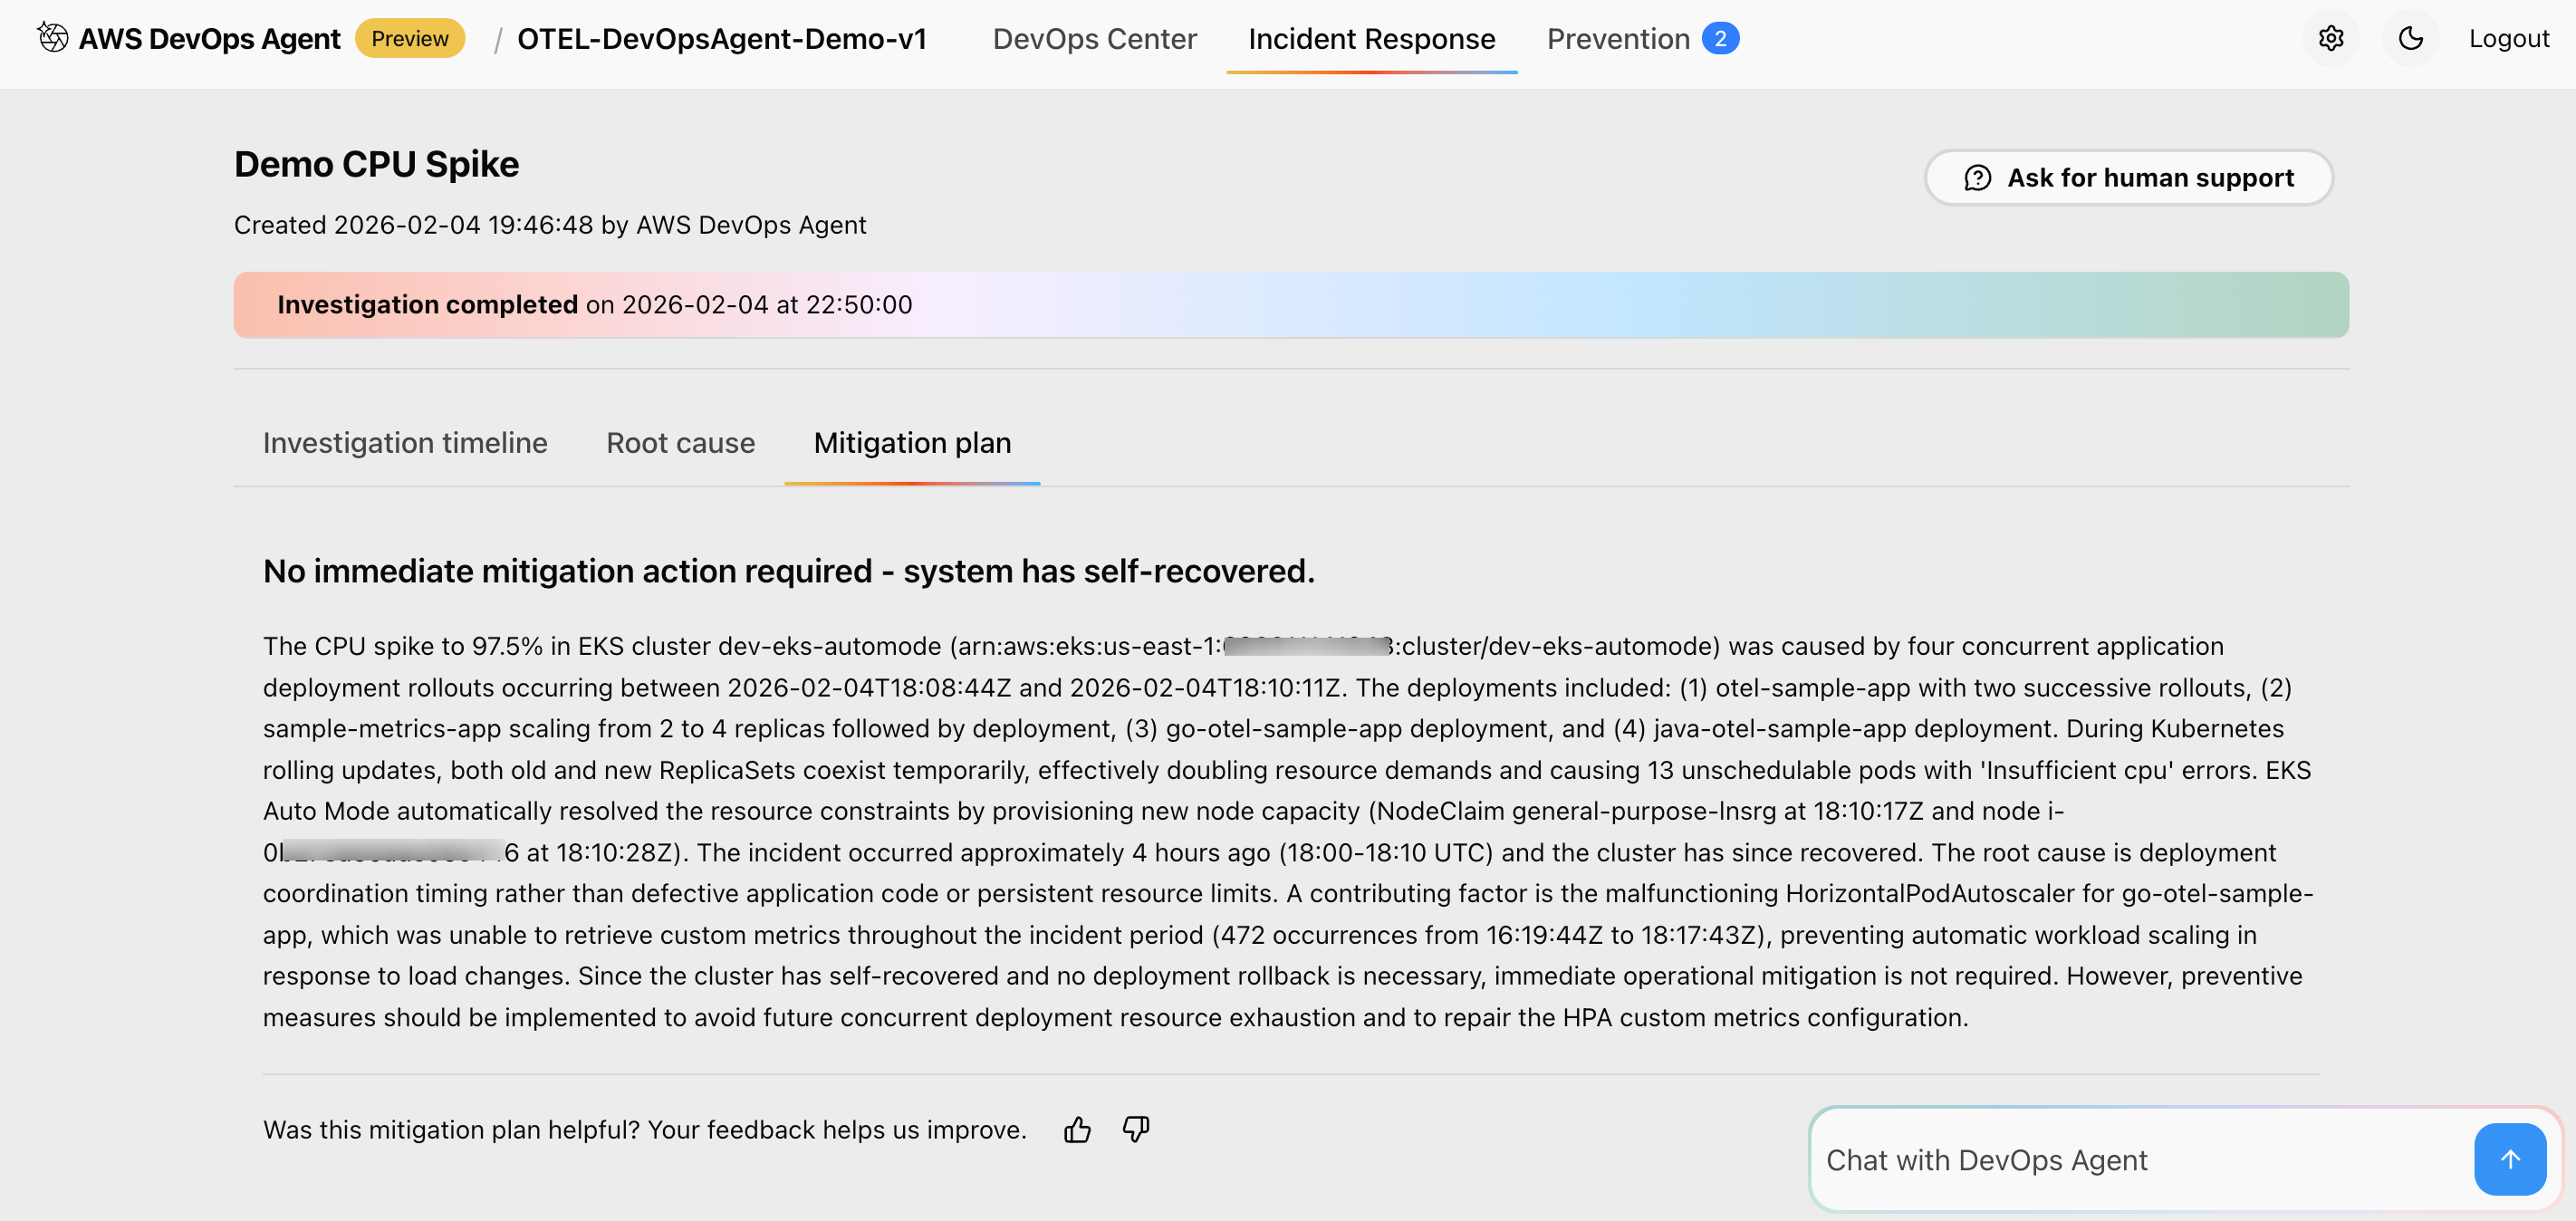 Figure 15: This is screenshot of mitigation summary recommended by the AWS DevOps agent
This approach recommends immediate mitigation actions to resolve current issues. It also suggests long-term prevention strategies to avoid recurrence, provides runbook-style guidance for event response teams, and integrates with existing DevOps workflows and tools for seamless incident response and improvement.
Key features and benefits
Preventing future incidents
AWS DevOps Agent analyzes patterns across your incident investigations to deliver targeted recommendations that continuously improve your operational posture and prevent future incidents.
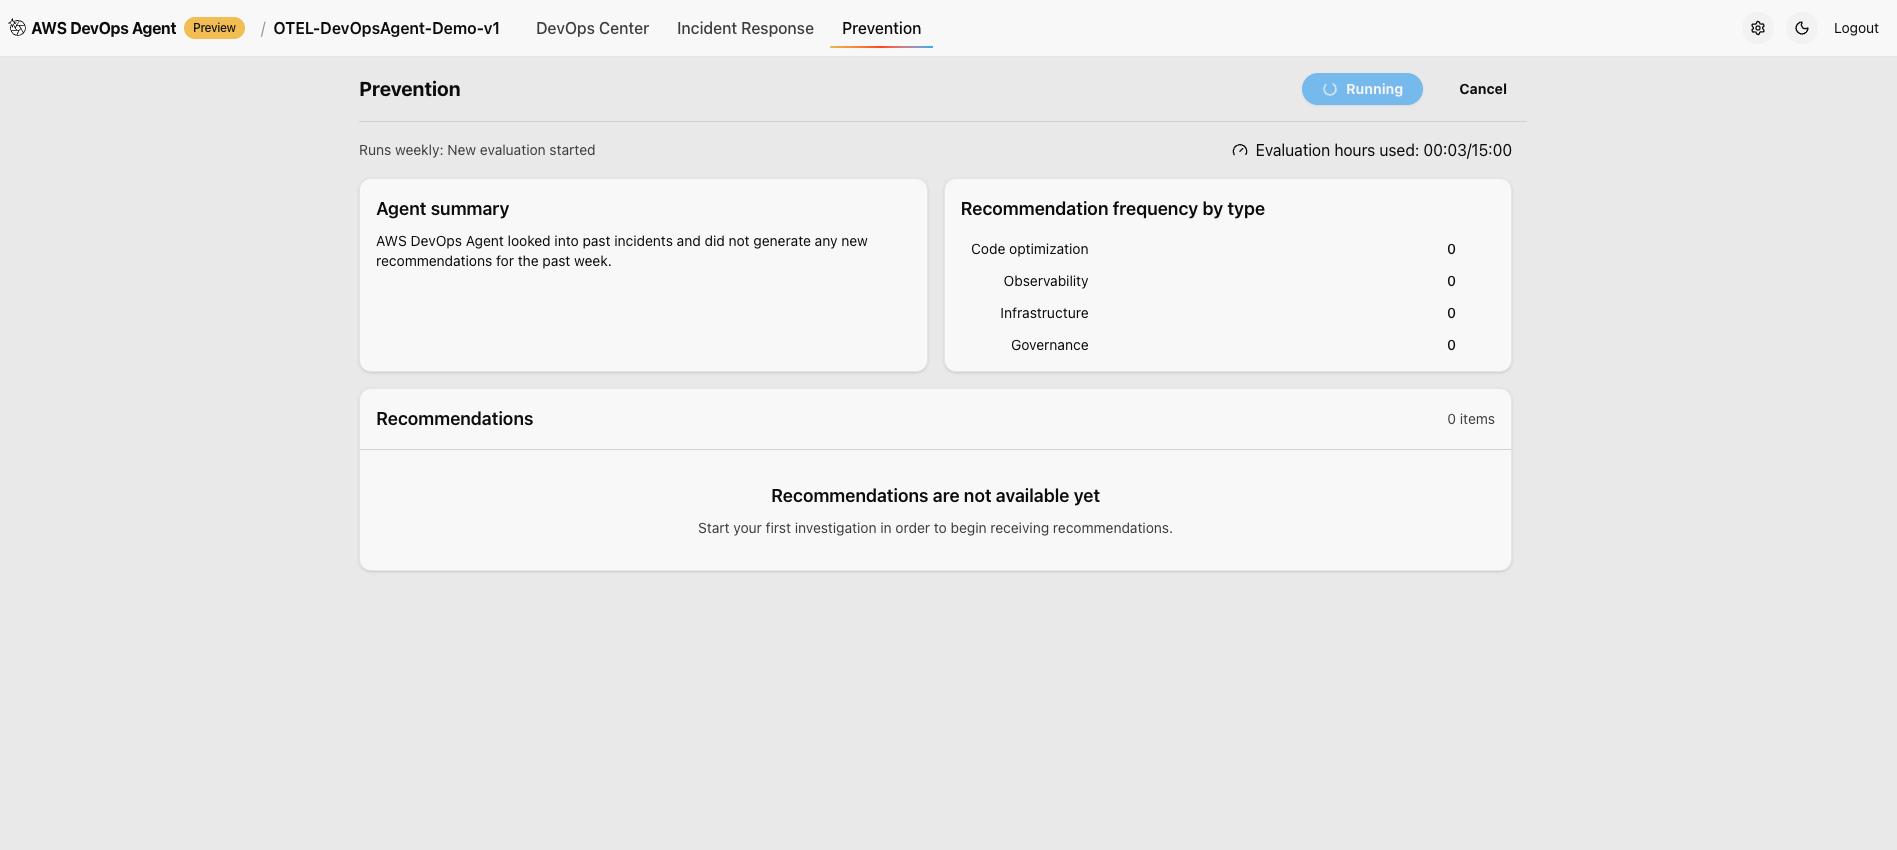 Figure 16: This is screenshot of prevention tab in the AWS Console for the AWS DevOps agent
DevOps Agent topology
AWS DevOps Agent Topology automatically discovers and maps your entire infrastructure into an interactive, living blueprint. It reveals not only what resources exist, but how they interconnect, depend on each other, and drive system behavior.
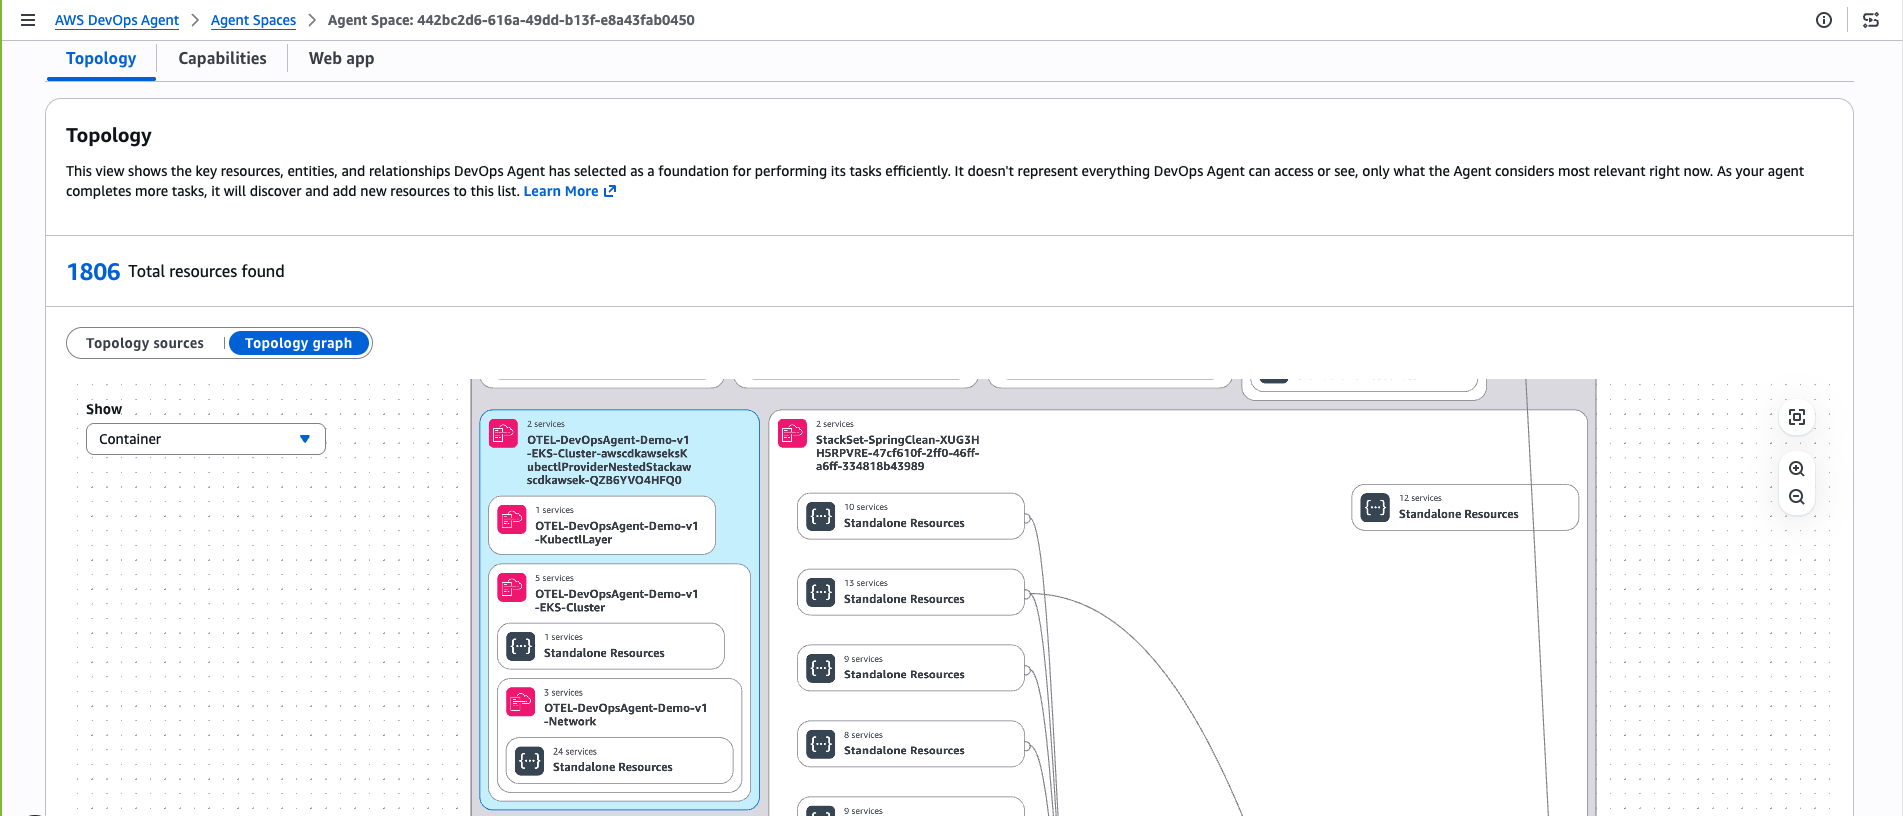 Figure 17: This is screenshot of topology of Amazon EKS cluster discovered by AWS DevOps agent
Clean up
To avoid ongoing charges, delete the resources that you created while following this walkthrough.
Remove AWS DevOps Agent resources:
- Delete investigation data and Agent Space configuration through the AWS Console.
- Remove IAM roles and policies created specifically for the DevOps Agent.
- Delete any CloudFormation stacks created during deployment.
Conclusion
As organizations continue to embrace cloud-native architectures and DevOps practices, tools like AWS DevOps Agent will become essential for maintaining competitive advantage in an increasingly complex technological landscape.
Ready to add AI powered observability to your container infrastructure? Visit the AWS documentation to access implementation guides, or reach out to your AWS account team to discuss how this automated migration approach can accelerate your cloud modernization journey, while reducing operational overhead.
About the authors
Author: Aritra Nag