
How TReNDS automates root-cause analysis with Amazon Bedrock
As our application grew, so did the volume of errors we needed to investigate… It combines Amazon CloudWatch subscription filters, AWS Lambda, the Strands Agents SDK, and Amazon Bedrock to detect errors in real time, enrich them with log context and source code from GitHub, and deliver AI-powere…
This is a guest post co-written with Vitaly Omelchenko from the TReNDS Center at Georgia State University.
At the Center for Translational Research in Neuroimaging and Data Science (TReNDS), a joint center of Georgia State University, Georgia Institute of Technology, and Emory University, we develop and apply advanced analytical methods and neuroinformatics tools for brain health research. We’ve been running our infrastructure on Amazon Web Services (AWS) since 2019, and over the years we’ve built a diverse set of applications, including research tools and APIs, all running on Amazon Elastic Kubernetes Service (Amazon EKS) with logs shipped to Amazon CloudWatch using FluentBit.
As our application grew, so did the volume of errors we needed to investigate. When we started exploring Amazon Bedrock, we saw an opportunity we had wanted for a long time. We could automate the most time-consuming part of incident response, the root-cause investigation itself.
In this post, we share the architecture we built and use in production at TReNDS. It combines Amazon CloudWatch subscription filters, AWS Lambda, the Strands Agents SDK, and Amazon Bedrock to detect errors in real time, enrich them with log context and source code from GitHub, and deliver AI-powered root-cause analysis to our team.
The architecture and recommendations in this post reflect our team’s experience at the TReNDS Center and do not represent official guidance from Georgia State University, Georgia Institute of Technology, or Emory University.
The problem we wanted to solve
Like many teams, we had alerting and monitoring in place. We knew when things broke. However, knowing that something failed and understanding why it failed are different things. Our engineers still had to open Amazon CloudWatch Logs, read through stack traces, find the relevant source files, and mentally trace the execution path. For straightforward errors, this took 15–30 minutes. For complex issues spanning multiple services, much longer.
We realized that this investigation process is exactly the kind of work a foundation model with the right tools can do. The model does more than summarize the error message. It investigates the error by pulling the surrounding log context, reading the source code, and producing a structured analysis. That is what we set out to build.
Architecture
Here’s the architecture we arrived at:
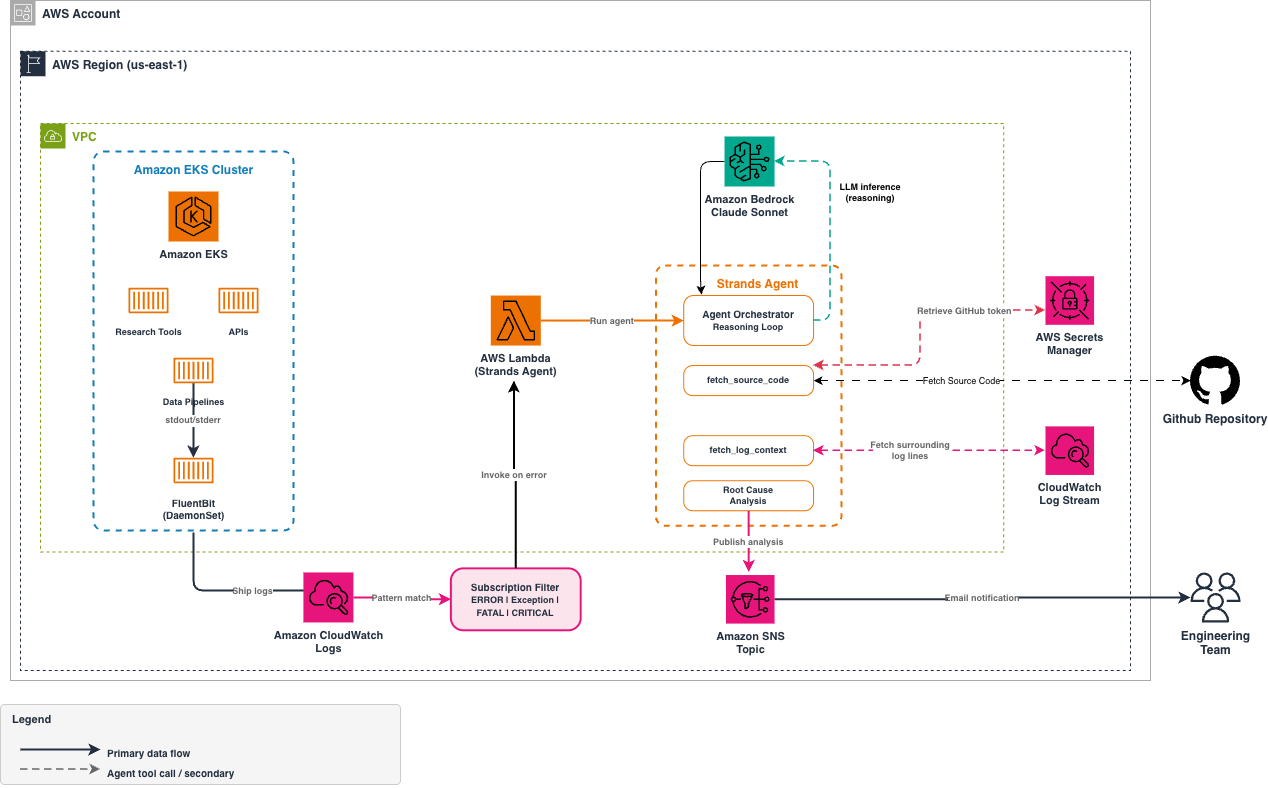
Figure 1 — Architecture for automated root-cause analysis
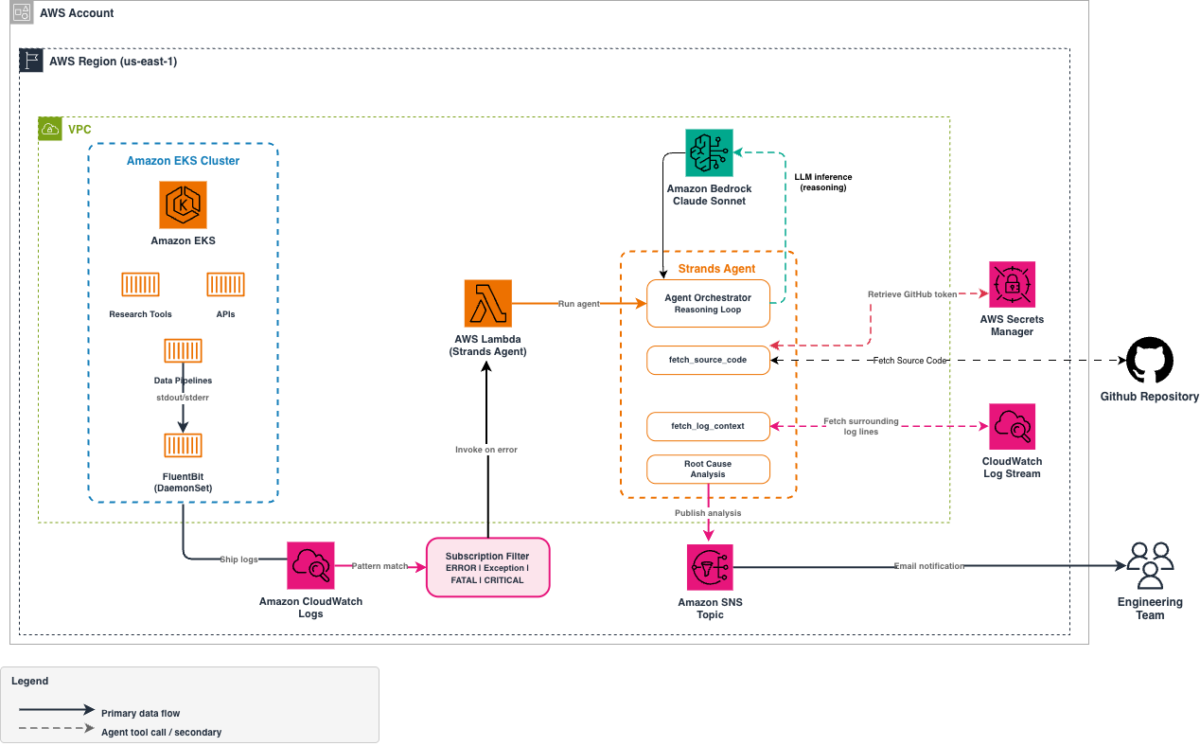
Our applications on EKS send logs to CloudWatch using FluentBit. A CloudWatch subscription filter watches for error-level patterns (ERROR, Exception, FATAL, CRITICAL) and invokes a Lambda function when a match occurs. The Lambda runs a Strands Agent powered by Amazon Bedrock that investigates the error, then publishes the analysis to an Amazon Simple Notification Service (Amazon SNS) topic for delivery to our team.
The core of the system is Amazon Bedrock. The foundation model (FM) does the actual reasoning about errors, code, and root causes. We use the Strands Agents SDK on top of Amazon Bedrock to handle tool-use orchestration. We define what tools are available, and the model decides when and how to call them. Given a stack trace, the agent might fetch the relevant source file, realize it needs more context, search for related error handling, and produce a structured analysis, without us hardcoding that investigation path.
Because TReNDS works with health-related research data, data residency and compliance are important considerations. Amazon Bedrock processes requests within our AWS account, so log data and source code stay within the same environment as the rest of our application. The AI analysis doesn’t require sending data to external endpoints. This keeps data flows within boundaries we already manage. This is particularly important for our work, because TReNDS handles health-related research data that might fall under HIPAA requirements. For more on Health Insurance Portability and Accountability Act (HIPAA)-eligible AWS services, see the AWS HIPAA Eligible Services Reference.
While our setup uses EKS and FluentBit, this pattern works with other applications that send logs to CloudWatch, including ECS, Lambda, EC2, or on-premises workloads using the CloudWatch Agent.
Prerequisites
To implement this solution, you need the following:
- An AWS account with access to Amazon Bedrock (specifically Anthropic Claude Sonnet).
- An Amazon EKS cluster with applications sending logs to CloudWatch through FluentBit.
- CloudWatch log groups configured with subscription filters.
- A GitHub repository containing your application source code.
- The Strands Agents SDK installed (available through the official Lambda layer).
- Familiarity with Python.
- An Amazon SNS topic configured for notifications.
- An AWS Lambda function with appropriate IAM permissions to access Amazon Bedrock, CloudWatch Logs, AWS Secrets Manager, and SNS.
Building tools with Strands Agents SDK
The agent’s capabilities come from the tools we give it. Of all the tools we built, source code retrieval is the most critical. Stack traces reference file paths and line numbers, but without access to the actual implementation, the agent would be limited to log pattern matching. By giving the agent the ability to read source files, it can trace execution paths and identify the specific code that caused the failure. With the Strands Agents SDK, you define a custom tool by decorating a Python function with @tool. Here’s the tool we built to fetch source code from our GitHub repositories:
The docstring and type hints matter. Strands uses them to tell the model what the tool does and what parameters it expects. The model then decides when to call this tool based on what it finds in the error. See the custom tools documentation for more patterns.
For deployment, we use the Strands Agents official Lambda layer. There’s no need to bundle the SDK manually.
How the pipeline works
When an error occurs in one of our applications, the pipeline moves through four stages automatically. First, CloudWatch detects the error pattern and invokes our Lambda function with the compressed log data. The Lambda decodes the event, and the Strands Agent takes over from there. The agent fetches additional log context from the same container, retrieves relevant source code from GitHub, and reasons through the root cause. Finally, it publishes a structured analysis to SNS for delivery to our team. The following sections walk through each stage in detail.
Receiving and decoding CloudWatch events
CloudWatch subscription filters send base64-encoded, gzip-compressed log events to Lambda. Each invocation contains one or more log events that matched the filter pattern within a short time window. The Lambda handler decodes the information, extracts the log group name and matching events, and passes them to the agent for analysis. See the CloudWatch Logs subscription filter documentation for the standard decoding pattern.
Fetching extended context
The subscription filter delivers the matching log line, but a single line is rarely enough. The CloudWatch event information includes the logStream, which identifies the specific container that produced the error. We built a second @tool that fetches surrounding logs from the same stream. This gives the agent the full stacktrace and the request context that led to the failure, without noise from other concurrent requests:
By scoping to the log stream, we get a clean, chronological sequence of events from the same container. This includes the request that triggered the error, preceding warnings, and the full exception trace.
Agent analysis
The agent receives the error plus context, then autonomously decides what to investigate. Unlike a rule-based system that follows predefined decision trees, the agent interprets the error message, identifies file paths and class names in the stack trace, and determines which source files to retrieve. If the initial code review reveals that the error originates in a dependency or a shared utility, the agent follows that chain without additional prompting from us. We shaped the output format through the system prompt:
The system prompt defines a structured output format but leaves the investigation strategy to the model. The agent decides which tools to call based on what it finds in the error. A stack trace with clear file paths triggers fetch_source_code calls. An error without a stack trace might lead the agent to search the code base for the error message string. This flexibility is the core value of the agentic approach. We did not need to anticipate every type of error our applications can produce.
The Lambda handler ties everything together:
The handler creates an Agent instance with our chosen Amazon Bedrock model, the system prompt that defines the output format, and the list of available tools. It then passes the error message along with the log group name to the agent, which triggers the autonomous investigation loop.
Delivering results
After the agent completes its analysis, we publish the result to an Amazon SNS topic and fan out to email and Slack. Here’s what a typical notification looks like:
The agent autonomously investigated this error without human guidance. It read the relevant source code, identified the null check gap, and even flagged a similar pattern in another file. This demonstrates the value of the agentic approach. Rather than following a fixed checklist, the agent adapts its investigation strategy based on what it discovers at each step, much like an experienced engineer would.
Results
Since deploying this system, we have seen a clear impact on how our team handles production errors. The most immediate change is speed. Investigation time dropped from 15 to 30 minutes down to under 60 seconds. Because the agent’s analysis includes a suggested fix, our engineers often receive a ready solution in their inbox. They can go straight to implementing the fix instead of spending time on diagnosis.
The cost of running this system is negligible. Each analysis incurs only minimal Amazon Bedrock inference charges, typically involving two to three tool-use rounds per error. For our workload, this is a fraction of what the equivalent engineer time would cost.
Our developers receive the agent’s analysis by email, and the feedback has been consistently positive. The analyses provide a clear starting point for resolution, even for errors the engineer has not encountered before. Engineers can quickly understand what happened and what to do about it without additional investigation.
After a release, the same code path can produce repeated errors. Our deduplication, which uses Amazon DynamoDB, makes sure that only the first occurrence triggers an analysis. The rest are silently filtered, keeping inboxes clean and Amazon Bedrock costs low.
Choosing the right Amazon Bedrock model
Amazon Bedrock gives us access to a range of foundation models through a single API. We tested several to find the best fit for our error analysis use case, evaluating reasoning quality (understanding code and errors), tool use reliability (calling our GitHub and CloudWatch tools), latency, and cost per analysis.
| Model | Best For | Tool Use | Latency | Relative Cost |
| Anthropic Claude Sonnet | Complex multi-file reasoning, subtle code issues | Reliable | Fast | Medium |
| Anthropic Claude Haiku | Straightforward errors, high-volume triage | Good | Fastest | Low |
| Anthropic Claude Opus | Deep cross-service investigations | Reliable | Moderate | High |
| Amazon Nova Pro | General-purpose analysis, cost-effective | Good | Fast | Low |
| Amazon Nova Lite | Simple error classification, budget workloads | Good | Fastest | Lowest |
We selected Claude Sonnet as our primary model. In our testing, it consistently produced the most accurate root-cause analyses. It can trace through multi-file call chains, identify subtle issues like missing null checks, and reason about concurrency problems. For teams with different cost or latency requirements, the other models in the table are strong alternatives for simpler error patterns.
Switching models with Strands is a one-line change, which made our evaluation straightforward:
Note: Model IDs are updated regularly. See the Amazon Bedrock supported models documentation for current model IDs.
Next steps
We are exploring several extensions to this system. The first priority is connecting Retrieval Augmented Generation (RAG) with our internal runbooks.
- By integrating Amazon Bedrock Knowledge Bases with our internal runbooks and past incident reports, the agent will be able to reference TReNDS-specific procedures in its analysis.
- We also plan to implement a tiered model strategy. Simple, known error patterns would route to Haiku for fast, low-cost triage, while complex or novel errors would escalate to Sonnet for deep analysis. This would optimize both cost and response time across our error volume.
- Finally, we are working toward automated GitHub issue and pull request creation. When the agent identifies a potential fix, it would automatically create a GitHub issue with the analysis and open a pull request with the suggested code change, reducing the manual steps between diagnosis and resolution.
As we scale this further, we’re also looking at Amazon Bedrock AgentCore for managed agent runtime, observability, and identity management. See the Strands Agents examples for multi-agent and deployment patterns.
Conclusion
We built this system at TReNDS because we wanted every error in our application to get an instant, structured investigation instead of only an alert. Amazon Bedrock and the Strands Agents SDK made it straightforward to implement. We defined a few tools and wrote a system prompt. Now, we have an agent that reasons through production errors the same way an experienced engineer would. It delivers results in seconds.
Adding a new capability means writing another @tool function and a few lines of Python. Whether the need is a Jira integration, a GitHub PR with a suggested fix, or a tool that connects to a running pod for deeper investigation, the pattern is the same. The foundation model handles the reasoning and orchestration, and we connect it to the systems it needs.
About the authors
Author: Vitaly Omelchenko