

How an AWS team detects dashboard content failures at scale using Amazon Bedrock
Picture a scenario familiar to any organization running business intelligence (BI) at scale: A user opens a dashboard minutes before an important meeting and finds a blank chart… Dashboard elements (tables, charts, and visuals) can display blank, stale, or incorrect data… Dashboard sections can…
Picture a scenario familiar to any organization running business intelligence (BI) at scale: A user opens a dashboard minutes before an important meeting and finds a blank chart. Every infrastructure monitor reports healthy. Servers are up, APIs respond, and the data pipeline completed on schedule. Yet the content on screen is broken, and no monitoring system has flagged it. This class of failure is inherently silent: It exists only in what the user sees. That makes it invisible to infrastructure monitoring and dependent on users taking the time to file a report. Our instrumentation later showed that this happens in fewer than 1 percent of cases.
Dashboard elements (tables, charts, and visuals) can display blank, stale, or incorrect data. Common causes include upstream pipeline failures, permission changes, and transient infrastructure issues. Even when every chart renders correctly, the numbers themselves can be wrong. This risk grows as organizations feed dashboard data into AI systems that generate narratives for business leaders.
In this post, we describe how we built a last-mile automated content validation solution. It simultaneously scans hundreds of dashboards hosted on the AWS Insights application (powered by Amazon Quick) to detect missing or incorrect elements. With this solution, the BI and analytics team can fix issues before users see them. The solution actively monitors dashboards and visually analyzes them using large language models (LLMs) on Amazon Bedrock. It then alerts builders in real time when a health issue is detected. This reduced mean time to detection from up to 72 hours to less than 1 hour.
You will learn about:
- The content-layer monitoring gap, and why user reports alone cannot reliably surface content failures.
- A five-stage serverless validation architecture built on AWS managed services.
- Two parallel AI validation mechanisms, one for visual integrity and one for numeric consistency, built on the same design principle.
- Production engineering lessons: designing against false positives and keeping LLMs away from arithmetic.
Why content-layer validation matters
Traditional infrastructure monitoring confirms that services are running and APIs are responsive. However, a healthy infrastructure doesn’t guarantee that the content your users see is correct. We found this gap manifests as two distinct problems:
- Silent visual failures. Dashboard sections can appear blank, display stale data, or show error states even when all upstream services report nominal health. After automated monitoring was in place, 30 days of data quantified the gap. It detected 802 content failure instances (row-level data permission errors, filters skipping records, rendering issues, and so on). Fewer than 1 percent had a corresponding user report. Without automated detection, this class of degradation is effectively invisible to reactive support channels.
- Undetected numeric inconsistencies. A chart can render perfectly and still show the wrong number. Filter misconfigurations, aggregation logic errors, and refresh timing issues produce discrepancies that only appear in the rendered output. Data-layer validation never surfaces them. The stakes rise when AI narrative systems consume this data, because a numeric error propagates directly into the insights that inform executive decisions.
Where existing monitoring tools fit
It’s worth noting that Amazon CloudWatch Synthetics already handles endpoint monitoring (pages load, links resolve, latency holds), and data-layer validations catch pipeline failures upstream. The gap is at the BI presentation layer. There, a filter misconfiguration, aggregation logic error, or refresh timing issue causes incorrect numbers to appear on screen despite all upstream checks passing. That last-mile, semantic judgment is what this solution adds. It supplements both infrastructure monitoring and data-quality validation. It does not replace either.
How it works: The experience
From a dashboard owner’s perspective, it takes a couple of configurations to define the metric and dashboard comparison scope. When a visual content failure is detected on a section they own, they receive a Slack notification. The notification contains the affected section name, a screenshot showing the failure, the AI confidence score, and a direct link to the monitoring dashboard for investigation.
For numeric validation, each weekly data refresh triggers a validation cycle that produces a human-readable report. Only flagged mismatches require reviewer attention, and confirmed data issues are escalated to the owning team.
Solution overview
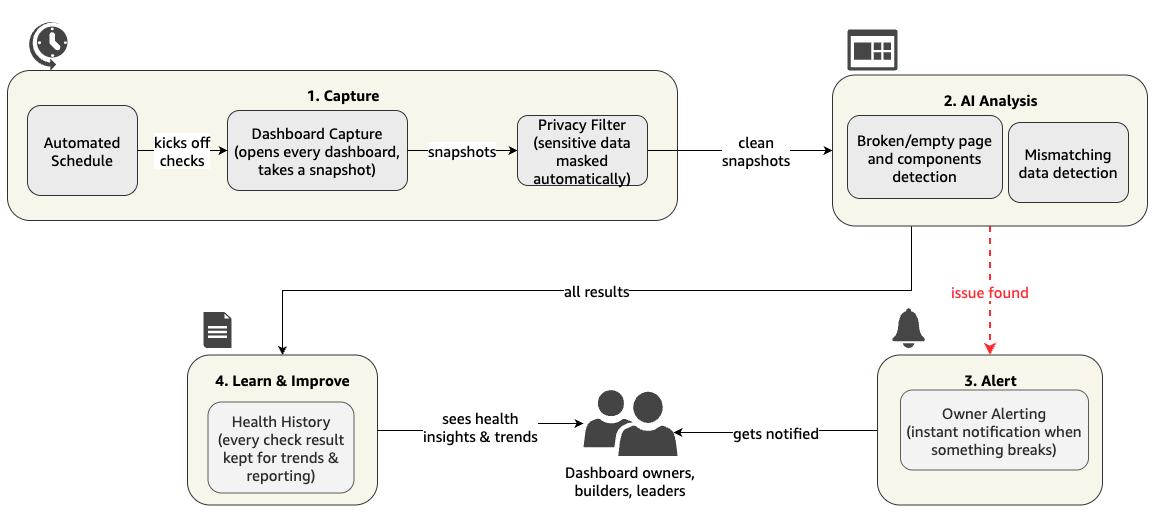
To address these challenges, we designed an AI-powered last-mile automated content validation solution. The following diagram illustrates the solution workflow at a high level.
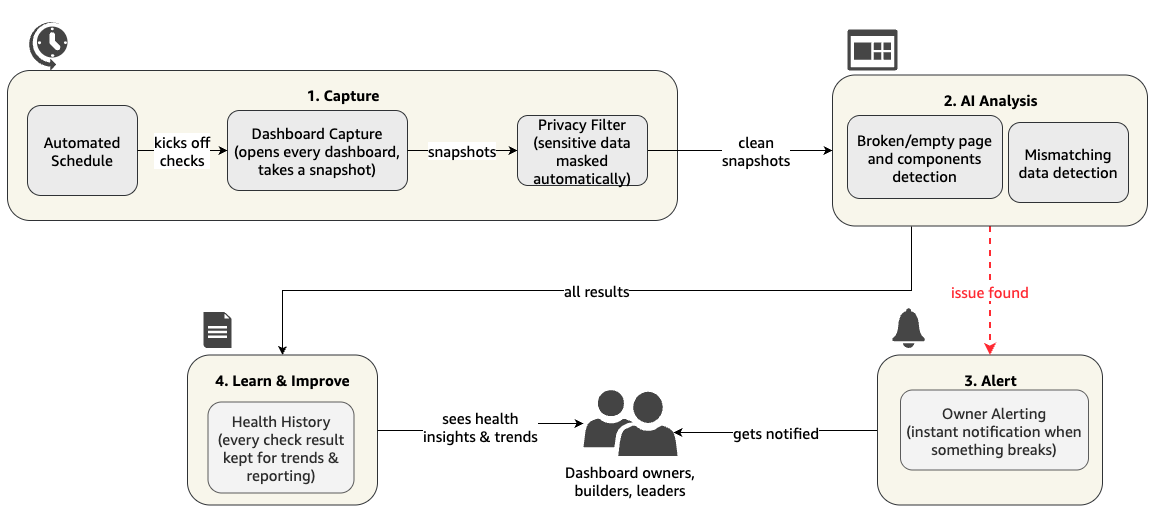
Figure 1: Last-mile automated content validation solution overview
This high-level view traces the flow from scheduled capture, through AI analysis, to owner alerting. The following diagram expands it into the end-to-end processing pipeline, including the numeric validation components added to the original visual validation structure.
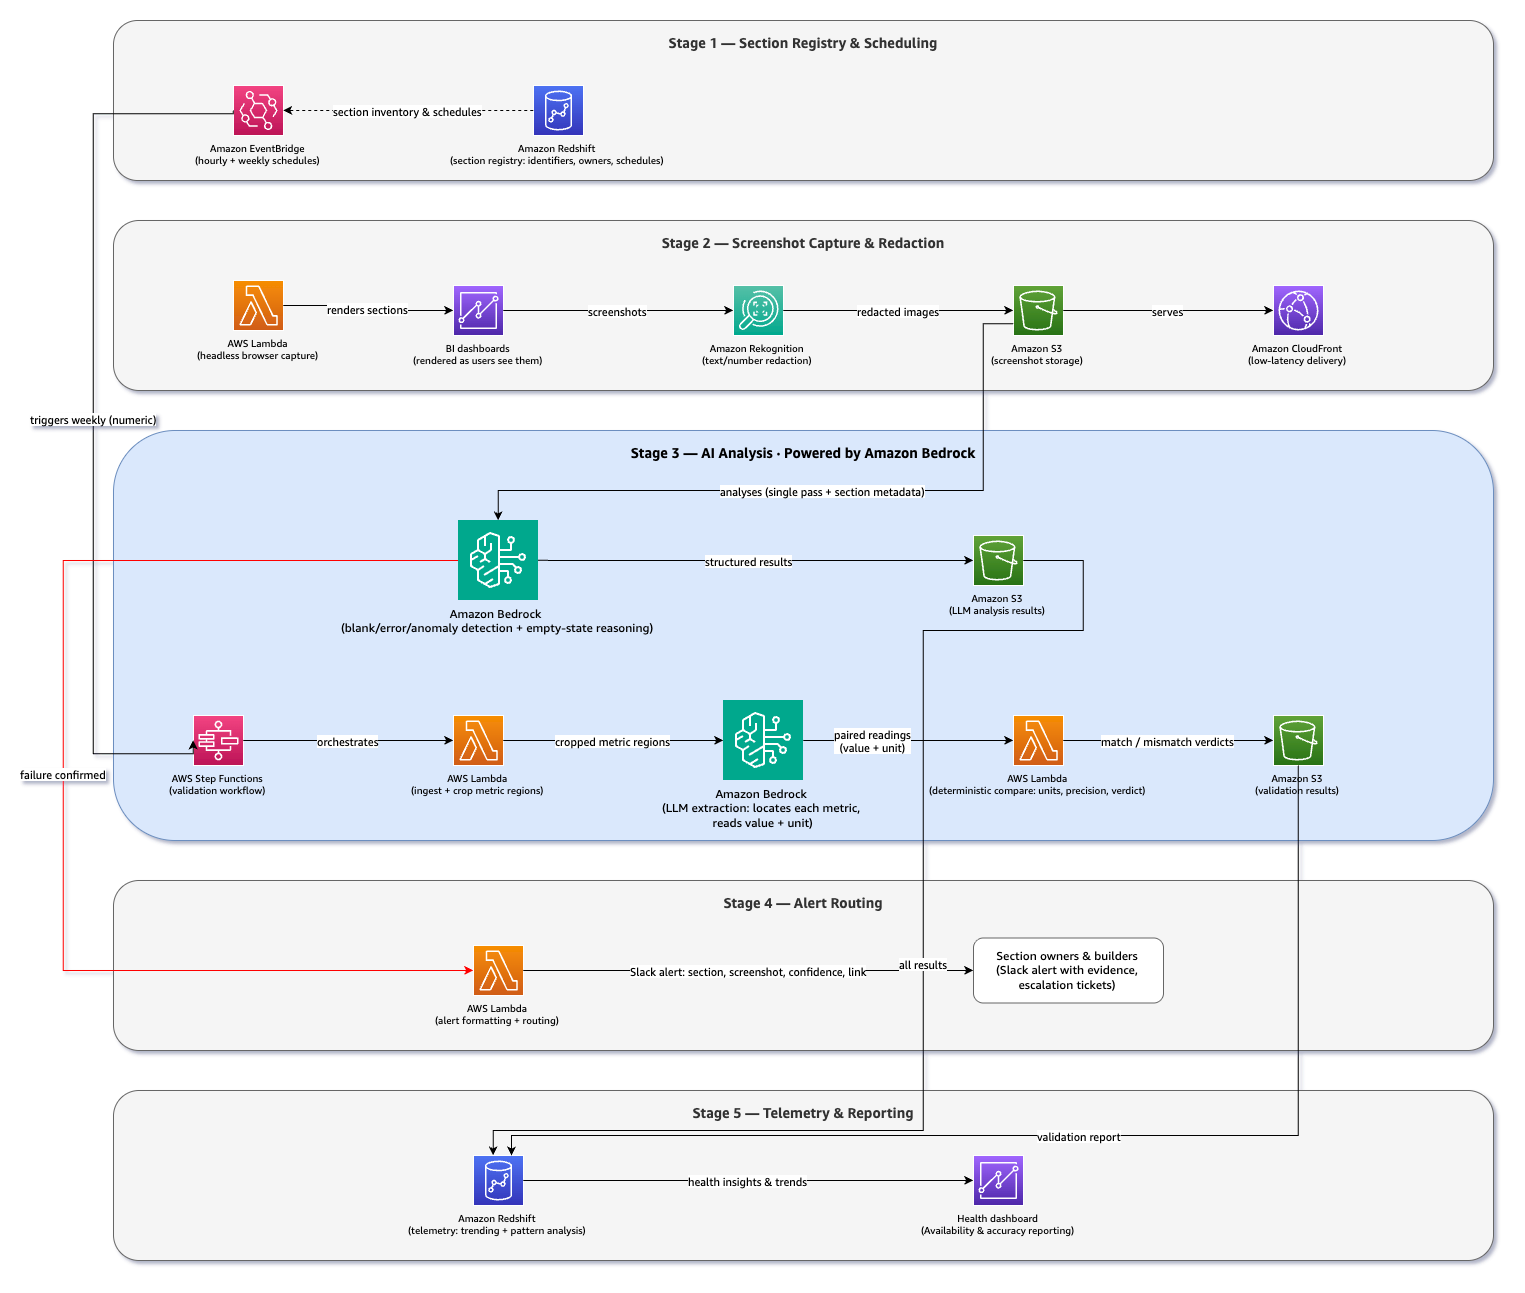
Figure 2: End-to-end processing pipeline showing the five stages, with the two parallel validation mechanisms in Stage 3
The solution uses five processing stages, each built on serverless and managed AWS services that scale to zero between validation cycles, so costs stay proportional to actual usage.
Stage 1: Section registry and scheduling. Amazon EventBridge triggers hourly validation cycles for visual checks. Weekly data refreshes trigger numeric validation cycles. A configuration registry in Amazon Redshift maintains the inventory of monitored sections, including section identifiers, owner assignments, and scheduling preferences.
Stage 2: Screenshot capture. The two mechanisms capture evidence differently, matched to what each task requires. For visual checks, AWS Lambda functions orchestrate headless browser sessions that render each dashboard section exactly as a user would see it. For numeric ground-truth capture, rendering alone isn’t enough: The agent must navigate dashboards and apply specific filters, so an agentic browser automation approach is used instead (described in Stage 3).
Before storage, each screenshot passes through a redaction step: Amazon Rekognition detects text and numeric values within the image. The pipeline then replaces them with masked equivalents, text with redacted placeholders and numbers with synthetic values, so no sensitive data is retained in the stored screenshots. The pre-trained optical character recognition (OCR) and text-detection models of Amazon Rekognition require no custom training and scale automatically with Lambda invocations, making the redaction both low-effort and repeatable. Screenshots are then stored in Amazon Simple Storage Service (Amazon S3) and served through Amazon CloudFront for low-latency access during analysis.
Stage 3: AI analysis. This stage runs two parallel validation mechanisms. Both follow the same design principle: AI models handle tasks that require semantic understanding, while deterministic logic handles decisions where precision is non-negotiable.
Visual content validation. Each screenshot is analyzed in a single pass, together with contextual metadata about the dashboard section. Anthropic Claude models, available on Amazon Bedrock, detect structural anomalies such as blank tiles, error states, and missing visuals. They also apply contextual reasoning to the hardest part of the problem: distinguishing a legitimately empty state (a filter combination that genuinely returns no data) from an actual content failure (a pipeline error rendering a blank chart). For model availability by AWS Region, refer to Supported models by AWS Region in Amazon Bedrock. Several production controls bound the model’s role. Screenshots are redacted before analysis (Stage 2). Model outputs are constrained to structured verdicts with confidence scores rather than free-form text. Ambiguous results route to human review instead of triggering automatic alerts.
Numeric cross-source validation. The second mechanism cross-checks the same metric for consistency across the dashboards where it appears. It uses a pattern we call hybrid validation: LLMs handle the semantic work, and deterministic code handles the numeric verdict. The same metric rarely appears with the exact same label or layout on two dashboards, so recognizing it requires semantic understanding. An LLM on Amazon Bedrock locates each declared metric in the captured screenshot, reads its value and unit, and produces paired readings. LLMs apply comparison rules inconsistently: when to round, what tolerance to allow, how to treat differing units. Deterministic code therefore handles unit normalization ($1.2B compared to $1,200M) and decimal precision (58.484 compared to 58.5). It then returns a verdict on each metric pair (matched or mismatched), giving reviewers a clear signal to act on.
Stage 4: Alert routing. When a visual failure is confirmed, the system generates a Slack notification using Block Kit formatting. It routes the notification to the registered section owner with visual evidence, confidence scores, and actionable investigation links. For persistent failures, the system escalates by automatically creating tickets routed to the owning team. Numeric mismatches are compiled into a validation report for human review.
Stage 5: Telemetry persistence. Analysis results are persisted to Amazon Redshift for historical trending and pattern analysis. Amazon CloudWatch provides operational metrics for the monitoring system itself.
Engineering for production
Moving from prototype to production surfaced two lessons that apply if you’re building AI-powered validation systems.
Design against false positives first
In alerting systems, false positives are the failure mode that kills adoption: Owners who receive false alarms stop trusting notifications. The hardest cases are not obviously broken pages but ambiguous ones, where a section is empty because a filter combination genuinely returns no data. Prioritize contextual reasoning over raw speed: Accepting slower per-check analysis buys you judgments that your owners can act on without second-guessing. For hourly monitoring cycles, accuracy and explainability outweigh real-time requirements.
Keep LLMs away from arithmetic
The numeric validation mechanism initially used a two-layer LLM design: one agent extracted and compared values, and a second judge agent independently verified the results. Both had access to calculator tools. Despite this, production runs revealed occasional errors, not in raw arithmetic but in comparison logic consistency. The issues involved when to round, what tolerance to apply, and how to handle unit differences. For a validation system, even occasional inconsistencies undermine confidence in every verdict.
Replacing the comparison stage with deterministic code changed precision from a model-dependent outcome into a design guarantee. Given correctly extracted values, programmatic comparison produces no errors, regardless of which model performs extraction. Subsequent model upgrades then improved the extraction stage and raised recall from 0.88 to 0.95 by reducing false alarms from misread dashboard values.
The key lesson across both validation mechanisms is the same. When you design your own system, assign AI to the semantic tasks it excels at: seeing, reading, and navigating. Assign deterministic code to the verdicts where a single error erodes trust.
Implementation results and impact
Over 30 days of production operation of the visual validation mechanism, the system demonstrated the following results:
- Hundreds of dashboards under continuous monitoring.
- 153,000 automated content checks performed.
- 802 content failures detected (0.52 percent of all checks), equivalent to 99.48 percent system content availability.
- Detected failures were distributed across a wide range of monitored sections rather than confined to a few problem dashboards, which confirms that content-layer monitoring requires full coverage, not spot checks.
- Mean time to detection reduced from up to 72 hours to less than 1 hour: because validation cycles run hourly, worst-case detection time is bounded by the scan interval.
The numeric validation mechanism has run in weekly production cycles for more than 6 months and validates 50–70 data points per cycle. Matched values are automatically approved through the deterministic comparison design, and in production evaluation to date, no data issue has bypassed human review as a false approval. In one production cycle, the system detected a systematic inconsistency affecting a family of related metrics. The issue was escalated and resolved before the data reached downstream consumers.
Looking forward
The next phase focuses on three capabilities:
- Cross-dashboard consistency checks that compare values that should align across related sections throughout the AWS Insights application.
- An automated recommendation system that analyzes error patterns to suggest remediation actions based on historical resolution data.
- Predictive analytics that use historical failure patterns to anticipate issues before they impact users.
Conclusion
In this post, we showed how our team built a proactive content validation system. It monitors hundreds of live dashboards through two parallel AI mechanisms: LLM visual reasoning for visual integrity, and agentic extraction with deterministic comparison for numeric accuracy. With automated detection, you can resolve content failures before they erode user trust, and before they reach the AI systems and business leaders that consume the data.
The patterns demonstrated here transfer to organizations operating a business intelligence estate at scale. These include screenshot-based content validation with foundation models, browser automation as a ground-truth capture mechanism, deterministic verdicts in precision-critical stages, and ownership-based alert routing backed by a telemetry loop.
To get started with similar capabilities, explore Amazon Bedrock for foundation model access, and Amazon EventBridge and AWS Lambda for serverless orchestration. For a related approach to AI-powered business narratives, refer to How AWS SMGS uses an AI-powered conversational assistant to transform business management with Amazon Bedrock AgentCore. For text-to-SQL patterns used in our telemetry layer, refer to Text-to-SQL solution powered by Amazon Bedrock. For the latest developments, visit What’s New with AWS.
Acknowledgments
We thank our executive sponsors and mentors for the vision and guidance that made this work possible. Aizaz Manzar, Director of AWS Global Sales; Sujit Narapareddy, Director of AWS Insights; Bernardo Sajonz, EMEA Insights Products Leader.
We also thank the dedicated team members whose technical expertise and contributions were instrumental in bringing this product to life: Alfonso Mateos Vicente, Business Intelligence Intern; Chris Corcoran, Reliability Engineering Leader; Kimiya Yokoo, Senior Technical Product Manager; Matteo Paganotto, Sr. Data Engineer; Ryo Okano, Business Intelligence Engineer; Vaibhav Yadav, Data Engineer; Ruben Fondon Alcalde, Sr. Insights and Analytics Lead; Tatevik Hovhannisyan, Sr. Insights & Analytics Lead.
About the authors
Author: Kimiya Yokoo