Amazon CloudWatch Internet Weather Map – View and analyze internet health

New Map The new Amazon CloudWatch Internet Weather Map is here to help! Built atop of collection of global monitors operated by AWS, you get a broad, global view of Internet weather, with the ability to zoom in and understand performance and availability issues that affect a particular city… To …
 The Internet has a plethora of moving parts: routers, switches, hubs, terrestrial and submarine cables, and connectors on the hardware side, and complex protocol stacks and configurations on the software side. When something goes wrong that slows or disrupts the Internet in a way that affects your customers, you want to be able to localize and understand the issue as quickly as possible.
New Map
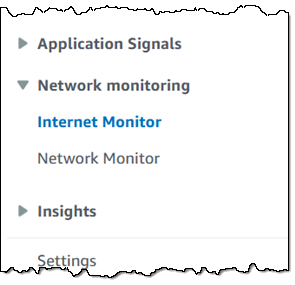
The new Amazon CloudWatch Internet Weather Map is here to help! Built atop of collection of global monitors operated by AWS, you get a broad, global view of Internet weather, with the ability to zoom in and understand performance and availability issues that affect a particular city. To access the map, open the CloudWatch Console, expand Network monitoring on the left, and click Internet Monitor. The map appears and displays weather for the entire world:

The red and yellow circles indicate current, active issues that affect availability or performance, respectively. The grey circles represent issues that have been resolved within the last 24 hours, and the blue diamonds represent AWS regions. The map will automatically refresh every 15 minutes if you leave it on the screen.
Each issue affects a specific city-network, representing a combination of a location where clients access AWS resources, and the Autonomous System Number (ASN) that was used to access the resources. ASNs typically represent individual Internet Service Providers (ISPs).
The list to the right of the map shows active events at the top, followed by events that have been resolved in the recent past, looking back up to 24 hours:

I can hover my mouse over any of the indicators to see the list of city-networks in the geographic area:

If I zoom in a step or two, I can see that those city-networks are spread out over the United States:

I can zoom in even further and see a single city-network:

This information is also available programmatically. The new ListInternetEvents function returns up to 100 performance or availability events per call, with optional filtering by time range, status (ACTIVE or RESOLVED), or type (PERFORMANCE or AVAILABILITY). Each event includes full details including latitude and longitude.
The new map is accessible from all AWS regions and there is no charge to use it. Going forward, we have a lot of powerful additions on the roadmap, subject to prioritization based on your feedback. Right now we are thinking about:
- Displaying causes of certain types of outages such as DDoS attacks, BGP route leaks, and issues with route interconnects.
- Adding a view that is specific to a chosen ISP.
- Displaying the impact to public SaaS applications.
Please feel free to send feedback on this feature to internet-monitor@amazon.com .
CloudWatch Internet Monitor
The information in the map applies to everyone who makes use of applications built on AWS. If you want to understand how internet weather affects your particular AWS applications and to take advantage of other features such as health event notification and traffic insights, you can make use of CloudWatch Internet Monitor. As my colleague Sébastien wrote when he launched this feature in late 2022:
You told us one of your challenges when monitoring internet-facing applications is to gather data outside of AWS to build a realistic picture of how your application behaves for your customers connected to multiple and geographically distant internet providers. Capturing and monitoring data about internet traffic before it reaches your infrastructure is either difficult or very expensive.
After you review the map, you can click Create monitor to get started with CloudWatch Internet Monitor:

After that you enter a name for your monitor, choose the AWS resources (VPCs, CloudFront distributions, Network Load Balancers, and Amazon WorkSpace Directories) to monitor, then select the desired percentage of internet-facing traffic to monitor. The monitor will begin to operate within minutes, using entries from your VPC Flow Logs, CloudFront Access Logs, and other telemetry to identify the most relevant city-networks.
Here are some resources to help you learn more about this feature:
- Amazon CloudWatch Internet Monitor Preview – End-to-End Visibility into Internet Performance for your Applications
- Introducing Amazon CloudWatch Internet Monitor
- Easily set up Amazon CloudWatch Internet Monitor
- Using Amazon CloudWatch Internet Monitor for enhanced internet observability
- Use Amazon CloudWatch Internet Monitor for greater visibility into online experiences
- Documentation: Using Amazon CloudWatch Internet Monitor
- Video: Amazon CloudWatch Internet Monitor
- More questions or comments, contact: internet-monitor@amazon.com
— Jeff;
Author: Jeff Barr
