
Automate safety monitoring with computer vision and generative AI
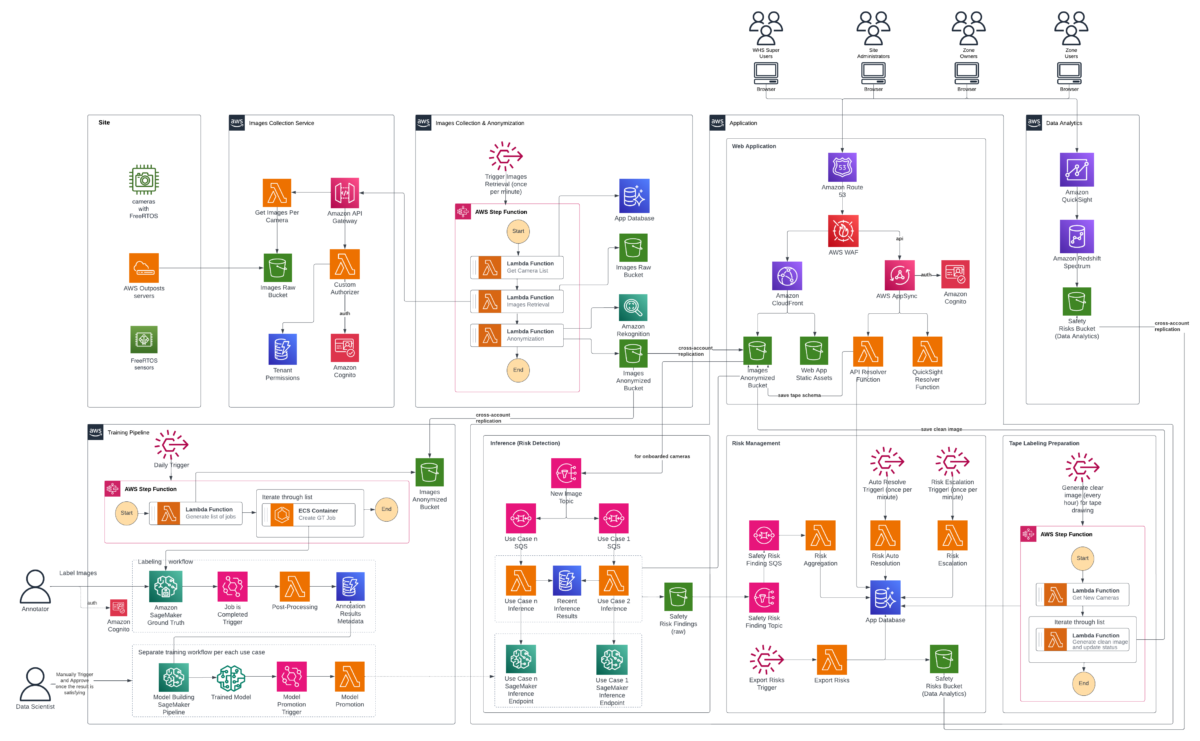
Solution overview Our computer vision solution uses a serverless, event-driven architecture designed to scale efficiently across thousands of cameras and process massive volumes of image data for risk detection… We separated the training pipeline, image collection infrastructure, end-user web a…
Workplace safety has improved dramatically over the past several decades. According to the Bureau of Labor Statistics, occupational injury rates in the United States have declined by more than 60% since the early 1970s. This is driven by stronger regulations, better training programs, and a growing culture of safety-first operations. Despite this progress, the International Labour Organization reports that 395 million workers worldwide still sustain non-fatal occupational injuries each year, and the National Safety Council estimates that workplace injuries cost the US economy $176.5 billion in 2023.
The challenge is no longer a lack of safety commitment, it’s the limitations of traditional monitoring methods. Manual safety audits, while valuable, cover only a fraction of operational areas and produce point-in-time snapshots rather than continuous oversight. As organizations scale across hundreds of facilities, whether manufacturing floors, distribution centers, airport tarmacs, construction sites, or laboratory environments, maintaining consistent, real-time visibility into Personal Protective Equipment (PPE) compliance and zone-based hazard monitoring becomes increasingly difficult.
According to OSHA, struck-by vehicle fatalities and injuries are 100 percent preventable, yet they remain a leading cause of workplace fatalities. However, 90 percent of workplace eye injuries can be avoided by wearing eye protection, according to the American Academy of Ophthalmology.
Computer vision and generative AI represent the next evolution in workplace safety, not replacing existing safety programs, but augmenting them with continuous, automated monitoring that scales across facilities around the clock. This post describes a solution that uses fixed camera networks to monitor operational environments in near real-time, detecting potential safety hazards while capturing object floor projections and their relationships to floor markings. While we illustrate the approach through distribution center deployment examples, the underlying architecture applies broadly across industries. We explore the architectural decisions, strategies for scaling to hundreds of sites, reducing site onboarding time, synthetic data generation using generative AI tools like GLIGEN, and other critical technical hurdles we overcame.
Solution overview
Our computer vision solution uses a serverless, event-driven architecture designed to scale efficiently across thousands of cameras and process massive volumes of image data for risk detection. The system includes the following:
- A machine learning (ML) model that identifies workplace safety hazards
- Real-time visual data processing for emerging risks
- A dual-detection annotation method that captures both object outlines and their floor projections relative to safety markings.
The system blurs human faces and identifiable features to help protect PII while maintaining hazard detection accuracy. To maintain proper security and operational segregation, the solution is distributed across multiple AWS accounts. We separated the training pipeline, image collection infrastructure, end-user web application, and created a dedicated analytics account for the BI team to develop reporting and insights solutions into distinct environments with appropriate access controls and data isolation. The system continuously learns to improve detection accuracy. Safety managers use monitoring dashboards to track and respond to hazards. The following architecture diagram illustrates how these components work together to create an end-to-end safety monitoring solution.

The system implements a hierarchical role-based access control structure with four user types.
- Super Users are system administrators with organization-wide visibility, responsible for site onboarding initialization and system health monitoring.
- Site Administrators operate at the facility level, configuring zones and managing permissions within their site.
- Zone Owners play a critical operational role—they receive and remediate safety risk notifications, complete tape labeling jobs to verify detection accuracy, and perform camera onboarding configuration. The system only begins automated risk detection after Zone Owners complete the full configuration process, so that parameters are properly set.
- Zone Users have read-only access to risks and alerts without configuration capabilities.
Image collection and anonymization
The workflow begins with automated image collection from configured and authorized site cameras through a dedicated image service providing periodic image capture. Raw images are initially stored in an Amazon Simple Storage Service (Amazon S3) bucket in a separate, access-restricted account where they immediately undergo an anonymization process. After anonymization is complete, raw images are automatically purged from the bucket within days, as per organizational retention policies. Amazon Rekognition detects faces of individuals present in the images, and custom Python code then applies an overlay to blur the detected faces, helping to preserve privacy. The anonymized images are replicated across multiple AWS accounts serving different purposes: training computer vision models, running inference to detect safety hazards, and powering the end-user web application where Zone Users monitor and respond to detected risks. The web application displays the anonymized images, which are annotated with visual indicators for missing PPE as an example or other potential safety hazard. This clear visual feedback eliminates guesswork so that Zone Users can quickly understand what hazard was identified and where it’s located on the facility floor, facilitating rapid response and remediation. Additionally, they can adjust the floor plan organization that defines the exact regions where workers are required to wear PPE or different objects and equipment are to be placed as per 5S taping and rules.
Training pipeline and model promotion
Machine learning systems need high-quality ground truth datasets. These labeled examples teach models to identify and classify safety hazards. Data labeling is the process of human annotators reviewing images and meticulously annotating objects, behaviors, and conditions of interest. For example, drawing bounding boxes around obstructions in walkways, identifying workers without proper PPE, or marking floor tape boundaries. Poor quality training data produces unreliable models that miss safety hazards or generate false alarms, eroding user trust. Conversely, investing in high-quality, accurately labeled training data—with clear, consistent annotations reviewed by domain experts—enables the model to detect genuine risks with precision and reliability. This ultimately determines the success or failure of the entire safety monitoring system. As described later in this post, synthetic data generation can complement or potentially substitute manual annotation for specific use cases where real-world examples are scarce or labor-intensive to collect.
After anonymized images are collected and stored into Amazon S3, the GT Job creation AWS Step Functions workflow creates Amazon SageMaker Ground Truth labeling jobs for the required use cases and monitored sites and cameras. This step function is triggered at a regular, configurable, cadence by an Amazon EventBridge rule. It integrates with Zone User feedback and saved ML model predictions, so data scientists can prioritize different underperforming classes and cameras. A team of dedicated annotators then complete the jobs. Completed jobs undergo post-processing using AWS Lambda to transform them into a format suitable for training. The post-processing workflow stores job metadata like included cameras and classes, into Amazon DynamoDB, while annotations are stored in an S3 Bucket. After training data is ready, data scientists trigger Amazon SageMaker AI Pipelines model building workflows using scripts that allow for flexible hyper parameter and GT data selection. The SageMaker AI Pipeline consists of seven steps:
- A checkpoint loading step
- A data preparation and split step
- A model training step
- A generate drift baseline step
- A model evaluation step
- A model packaging step
- A model register step
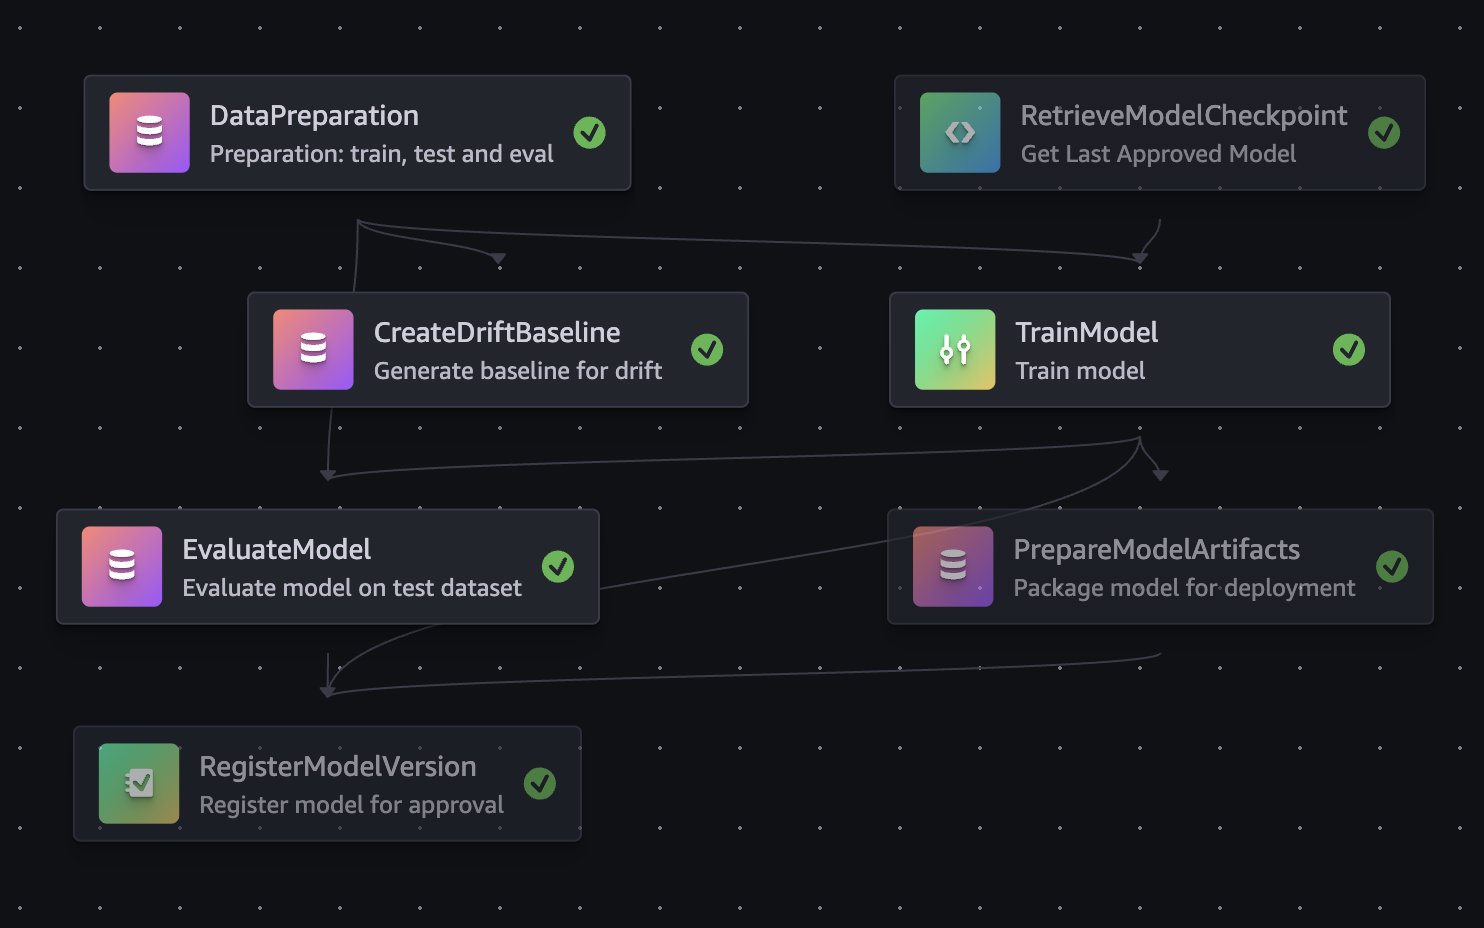
Data scientists review trained model evaluation metrics, and approve models that they want to use in the inference pipeline. Model approval fires off an EventBridge event that triggers the model promotion Lambda. The model promotion Lambda creates a code review against the application infrastructure code repository to update the Amazon S3 URI of the model used for the SageMaker AI endpoint. This workflow decouples the science and application updates. Scientists approve models when evaluation metrics meet acceptance criteria. Software engineers can then merge and manage the endpoint updates like other software and infrastructure changes through continuous integration and delivery (CI/CD) pipelines. After code review is passed, the system updates the SageMaker AI Endpoint accordingly and inference pipeline will use the updated endpoint. Approved models checkpoints are also used as the base for future retraining runs, enabling rapid incremental improvements without frequent long running training jobs.
Inference pipeline
Each use case operates through its own inference pipeline, working together to provide comprehensive safety oversight. The system functions as a digital safety supervisor, continuously monitoring facility operations and distinguishing between normal workflow and potential hazards. When an image lands in the anonymized S3 bucket, it triggers an Amazon Simple Notification Service (Amazon SNS) notification that routes to a dedicated Amazon Simple Queue Service (Amazon SQS) queue. Each use case processes independently through its own queue, which invokes a SageMaker AI Endpoint hosting a computer vision model tailored to that scenario. For example, detecting operational equipment, identifying workers with safety gear, or monitoring other safety-critical conditions. The “Intelligent Alarm Detection” section details how the system validates and escalates findings. Confirmed violations generate alerts containing the object type, precise location, and violation duration. Visual evidence includes both the original camera capture and an annotated version with color-coded overlays: blue outlines mark restricted zones, red outlines highlight violating objects, and confidence scores label each detection. Then, the system distributes alerts through parallel channels. DynamoDB stores structured violation records enabling fast queries. Amazon S3 events trigger downstream processing and notifications. Failures are tracked in use case specific Dead Letter Queues (DLQs) where they can later be analyzed or re-drove.
Risk management
When the inference pipeline detects potential hazards and saves them to the dedicated S3 bucket, it triggers a Lambda function using Amazon SNS and SQS. This function intelligently aggregates risks per camera per use case to avoid alert fatigue. Instead of bombarding safety teams with duplicate notifications, the system appends new occurrences to existing open risks. Every minute, an Amazon EventBridge schedule kicks off a Lambda function that checks whether risks still appear in the latest camera images. If a violation has been resolved, the system automatically closes it out. At the same time, another scheduled function monitors whether the SLA for risk resolution has been exceeded and sends notifications through zone’s configured preferred channels, Slack, email, or an internal ticket management system. The notification system includes escalation levels, so that the right people are alerted based on severity and how long an issue has been open. Every hour (though this schedule is flexible), the system exports risk data from the database reader endpoint and shares it with the BI team for deeper analysis and trend spotting.
Web application
Users review active and resolved risks through a React web application distributed via Amazon CloudFront and backed by an AWS AppSync API. The application follows AWS security best practices with Amazon Route 53 for DNS resolution and AWS WAF for protection against common web vulnerabilities. AWS AppSync uses AWS Lambda resolvers for embedding Amazon Quick Sight analytics and processing CRUD operations.
Site administrators can use a Site Management feature to configure use cases and notification parameters. Camera zones organize related risks into alerts for quick review. These can be acknowledged or marked as false positives, and the system automatically resolves alerts when risks are no longer detected. Users can also search historical risks, with both views displaying day-over-day trends, average resolution time, and false positive rates.
Tape labeling preparation
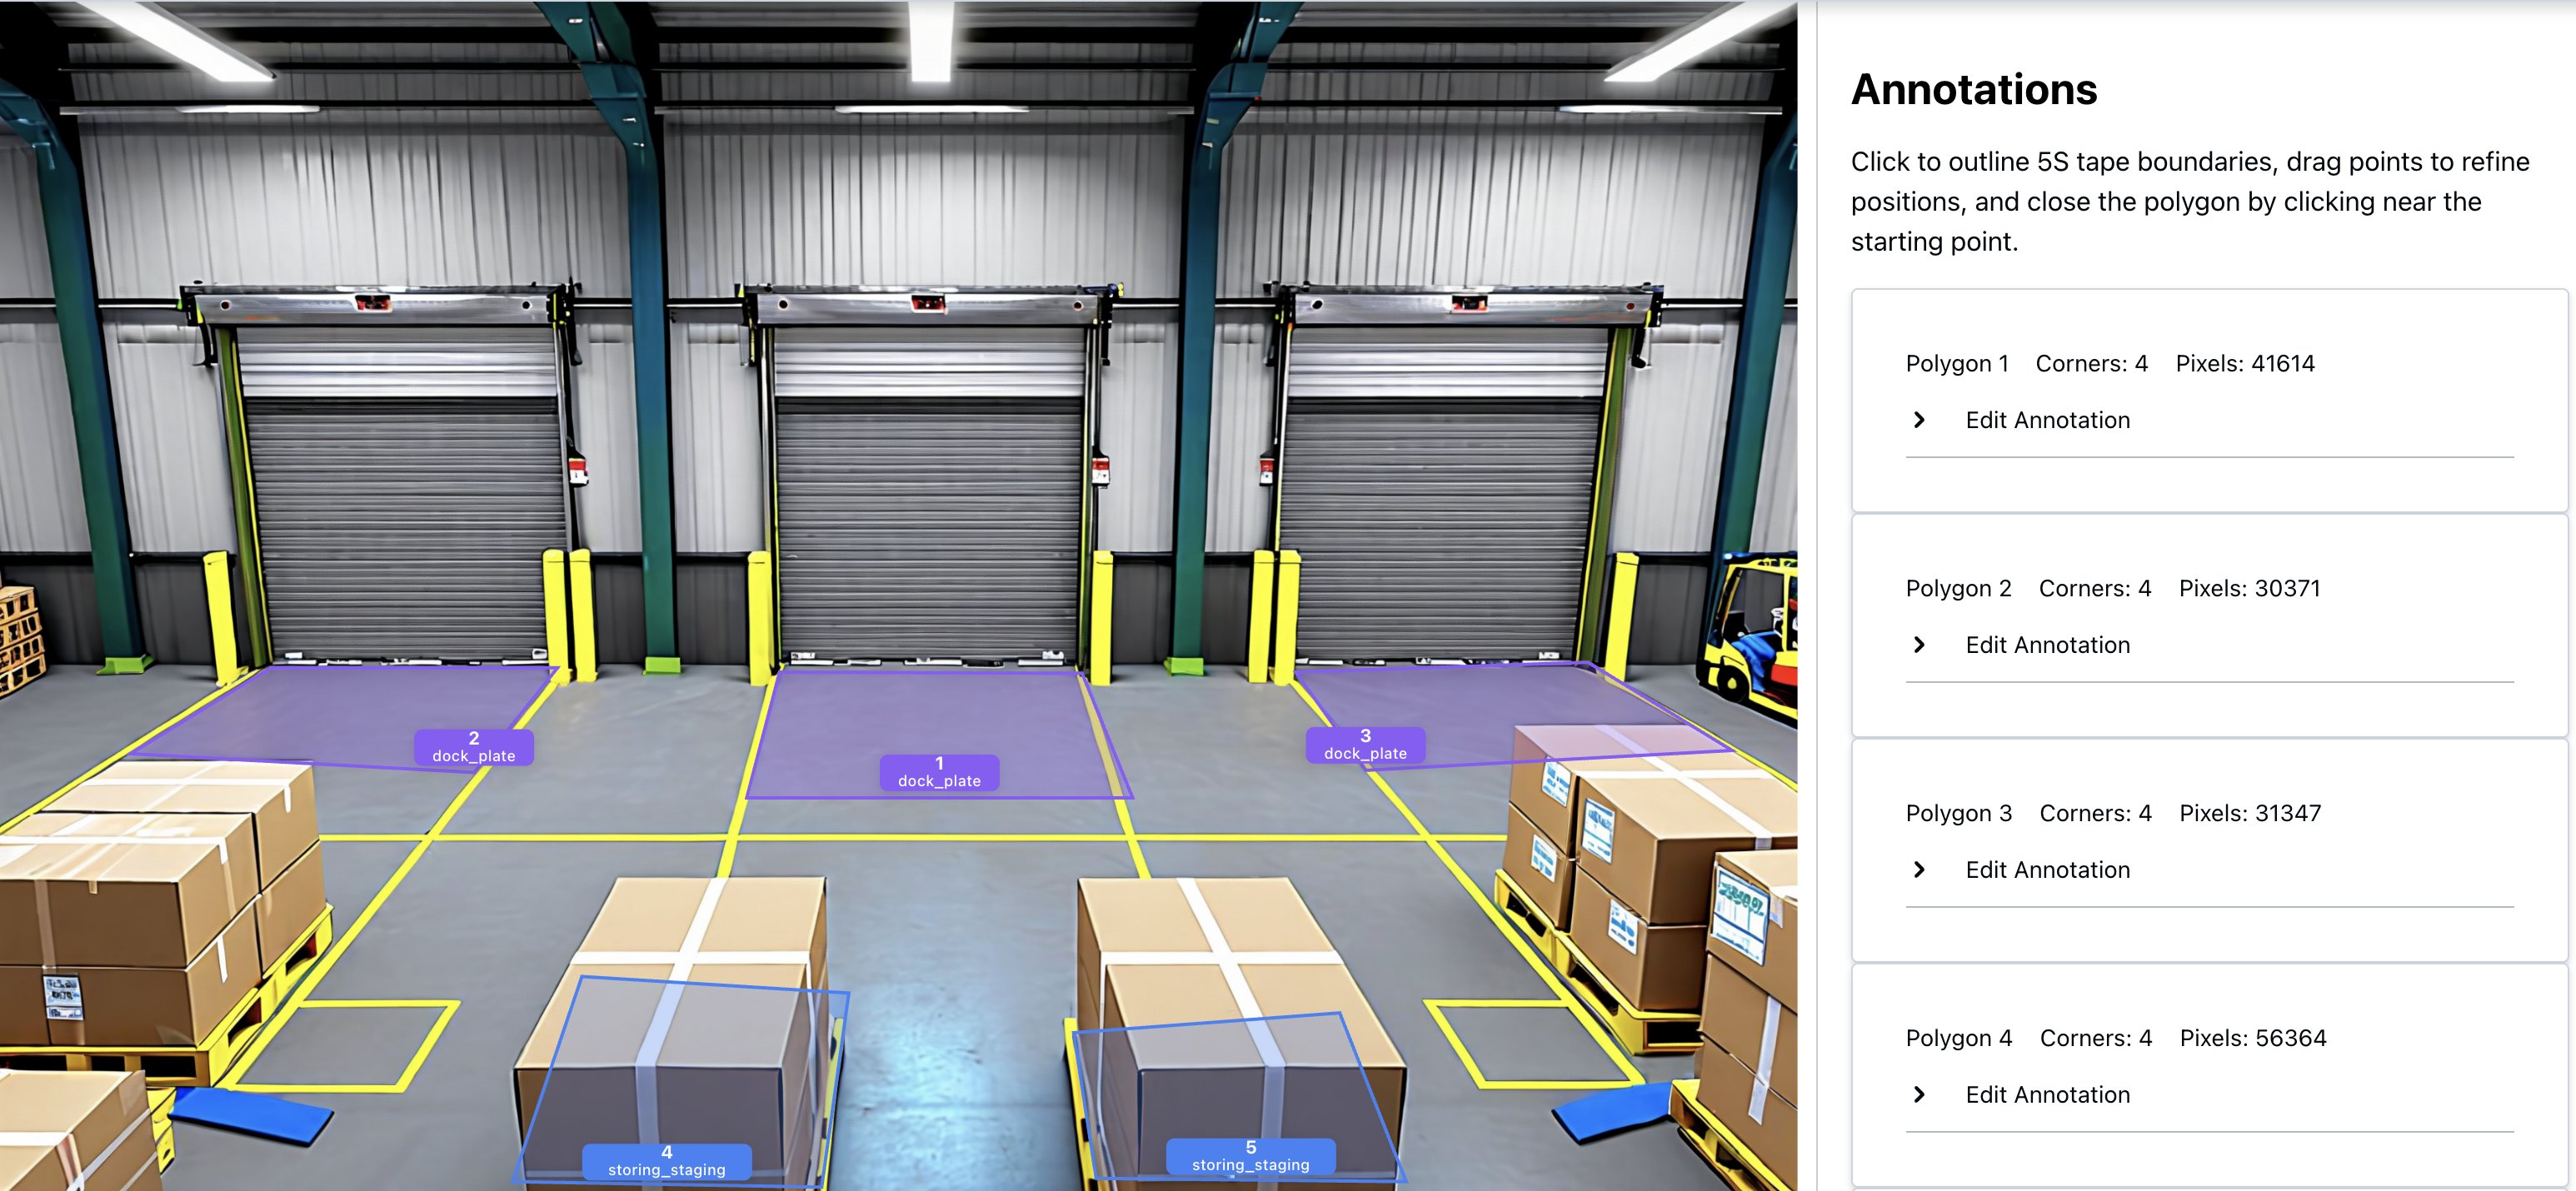
The Housekeeping use case fundamentally relies on understanding the spatial relationship between detected objects and the 5S floor tapes that define where equipment and materials should be positioned. Housekeeping, in this context, refers to maintaining a clean, organized, and safe workspace by keeping equipment, materials, and tools stored in their designated locations. A key advantage of this system is that it does not require pre-existing digital maps or floor plans. Instead, Zone Owners can define safety zones and organizational areas by referencing the physical tapes visible in camera images. Different color tapes represent places where certain objects belong and where restrictions exist. However, a practical challenge arises during normal facility operations: floor tapes frequently become obscured by equipment, materials, and personnel movement throughout the day. This occlusion makes it difficult for human annotators to accurately identify and label the tape boundaries when onboarding new cameras. To address this challenge, an intelligent tape labeling preparation workflow was developed that generates synthetic composite images showing clear, unobstructed views of the floor tapes. The system analyzes multiple camera frames captured at different times throughout the day, along with their corresponding object detection predictions. Using a voting mechanism, it identifies pixel regions with no detected objects and stitches these clear portions together into a composite image where the tapes are fully visible. This automated workflow runs hourly using AWS Step Functions. The first Lambda function identifies newly onboarded cameras requiring tape labeling, while the second generates composite images, saves them to Amazon S3, and updates camera status to indicate readiness for annotation. The Camera Onboarding process generates JSON files containing the coordinates of each 5S tape floor annotation for every camera. These annotations are accessible within the application, allowing users to inspect and modify them as needed when floor organization changes. During inference, the system overlays detected object positions onto floor tape boundaries and evaluates compliance against configured business and organizational rules. When violations are detected, Housekeeping alarms provide comprehensive context, including the outlined object in violation, the specific 5S taped area involved, and the rule that was broken. This detailed feedback enables operators to quickly localize issues and mark false positive alarms. The following image was generated by Amazon Nova to illustrate the tape labeling UI:
Data analytics component
Finally, this risk detection data gets turned into real business insights through Amazon Redshift Spectrum and Quick Sight. Redshift Spectrum lets the BI team query risk data sitting in S3 without the hassle of moving or loading it elsewhere, making historical analysis fast and straightforward.
Quick Sight dashboards give safety managers and operations leaders the full picture: which facility zones are hotspots for violations, how risks shift between day and night shifts, what types of objects cause the most problems, and whether your safety interventions are actually moving the needle. You can even compare performance across facilities to spot best practices worth replicating.
Intelligent Alarm Detection
The four-stage process
When an image arrives in the anonymized S3 bucket, the system processes it through four stages:
Stage 1: Object detection
The SageMaker Endpoint runs a computer vision model that detects operational equipment, materials, and worker safety gear. In the Housekeeping use case, the model identifies various equipment types such as transport devices, storage containers, and safety apparatus, along with materials commonly found in industrial environments. A critical capability is the model’s ability to distinguish between an object’s visible outline and its actual floor footprint.
Stage 2: Zone-based analysis with “Digital Tape”
Detection alone isn’t enough. The system must understand whether detected objects pose actual risks. Predefined zones, called “tapes,” mark restricted areas, walkways, and safety boundaries through labeling jobs. The system calculates the percentage overlap between each detected object’s footprint and these restricted zones. Configurable thresholds, typically 50% overlap, determine whether an object violates safety protocols, filtering out edge cases where objects barely touch boundary lines. For the PPE detection module, the system employs a YOLO-based computer vision model that performs simultaneous detection across multiple dimensions. It locates workers within the frame, classifies the presence or absence of required safety equipment, and applies contextual analysis to determine which PPE items are mandatory in specific areas. This contextual awareness allows the system to adapt its requirements to different zones within the operational environment.
Stage 3: The “Loiter Time” algorithm
To avoid false alarms from transient objects, the system tracks violations over time. It analyzes objects across consecutive time intervals, typically minute-by-minute, using mask similarity algorithms to confirm the same object persists rather than being replaced by similar items. This builds a “replication count” showing how many consecutive minutes an object has remained in violation. Different object types and risk zones have distinct acceptable loiter times—high-risk areas enforce shorter thresholds, while general workspace areas allow longer durations to accommodate normal operations.
Stage 4: Multilayered validation and alarm generation
Before generating an alert, the system applies final validation layers. Confidence thresholds filter out low-certainty detections based on object type complexity. Run-Length Encoding (RLE) mask comparison verifies that the tracked object is consistent across time intervals rather than different objects appearing in similar positions. Zone context determines the severity and routing of each alert. Once validated, an alert is generated with rich metadata:
Infrastructure scaling challenges
We designed the system to support thousands of cameras. This scale required careful architectural decisions.
Architectural foundation for scale
At the heart of our system is a serverless driver-worker pattern that proved essential for achieving the scale we needed. This pattern decouples image processing tasks, enabling independent scaling of different components while providing fault isolation. If one worker fails, it doesn’t impact the entire pipeline. The driver orchestrates work distribution while workers process images concurrently, allowing us to horizontally scale to handle simultaneous processing from hundreds of sites. This initial worker pulls the raw image and triggers a cascade of specialized downstream handlers that each contribute to the overall safety monitoring workflow.
The ML inference workflow acts as an intelligent gatekeeper in this architecture. Rather than flooding downstream components with every captured image, the inference layer only surfaces images where safety issues have been detected. This filtering is essential because it prevents components interacting with Amazon Aurora PostgreSQL from being overwhelmed by the raw volume of image data from hundreds of sites. For managing processing state, the ML inference components use DynamoDB, which provides the scalable, serverless state management needed to track inference operations across our distributed camera network.
Evolving our inference infrastructure
One of our most significant scaling challenges emerged as we transitioned from a proof-of-concept to production scale. Initially, we deployed SageMaker Serverless inference endpoints with approximately 50 cameras. However, as we scaled to processing images from hundreds of sites, we encountered critical limitations: SageMaker Serverless inference lacked GPU support and imposed a 6GB maximum memory configuration, leading to out-of-memory errors. The solution required pivoting to SageMaker Serverful inference endpoints configured with ml.g6 family instances and implementing auto scaling policies. Achieving scale also meant working with AWS service teams to increase limits for thousands of concurrent Lambda executions, optimizing memory allocation and multithreading, and tuning SQS batch sizes maximize throughput within memory constraints.
Optimizing Lambda and SQS for massive concurrency
Achieving the required scale also meant working closely with AWS service teams to increase limits supporting thousands of concurrent Lambda executions across our accounts. Beyond increasing limits, we invested significant effort in optimizing our Lambda configurations from memory allocation to processing logic that uses multithreading capabilities. The integration between Lambda and SQS required particular attention. We optimized Lambda functions for maximum consumption concurrency, refactored error handling to minimize failed containers, and tuned the maximum number of messages per batch to handle larger message volumes efficiently within memory constraints.
Data-driven ground truth curation at scale
While synthetic data generation significantly reduces the annotation burden, manual annotation remains important for addressing unique site conditions and onboarding new use cases. As the solution scales to new facilities, each site introduces distinct camera angles, lighting conditions, and equipment layouts that benefit from targeted real-world annotations to fine-tune model performance. Our approach to curating ground truth data for model training evolved significantly as we scaled. Initially, we implemented a straightforward but labor-intensive strategy: creating annotation jobs for every site on a daily basis. This approach worked well during early stages with limited sites, but as we expanded to hundreds of geographically distributed sites, the volume of manual annotation became untenable. The sheer number of daily labeling jobs – one per site per day – quickly overwhelmed our annotation capacity and created a significant operational bottleneck that threatened our ability to continuously improve model performance.
We fundamentally reimagined our workflow by using Amazon Athena to query and analyze massive volumes of inference results combined with customer feedback data at scale. We identified underperforming segments by aggregating false positive rates across camera types and deployment conditions, prioritizing retraining on image sources with elevated error rates. We also surfaced inferences where model confidence scores fell below established thresholds, flagging these uncertain predictions for targeted annotation and review. We further augmented this analysis with Claude multi-modal LLMs on Amazon Bedrock to analyze misclassified samples and detect underrepresented object classes in our existing training distribution. This directly informed our data collection strategy to address class imbalance and edge cases in future training jobs. This shift from blanket sampling to intelligent, performance-driven curation made our annotation workflow sustainable at scale. It also improved training efficiency by directing labeling efforts only where they would have the greatest impact on model improvement.
Images annotation at scale
Manual annotation of training data is challenging, especially for rare safety violations. The sheer volume of images combined with the labor-intensive nature of manual labeling, makes traditional annotation approaches impractical for certain use cases. Some safety violations are extremely rare in practice yet represent frequent sources of workplace injuries. A prime example is floor spill detection: despite examining and annotating over half a million images, only a few hundred examples of liquid spills or debris on walkways were identified. While this low occurrence rate is commendable from a safety perspective, it poses a fundamental challenge for model training. There aren’t enough real-world examples to train a robust detection model. Similarly, PPE detection presents a data diversity challenge. In the majority of captured images, PPE items appear in a single dominant color. However, workplace policies often permit variations, and workers occasionally wear acceptable PPE in different colors. Without sufficient training examples across color variations, the model risks failing to detect non-standard colored items, creating potential safety blind spots.
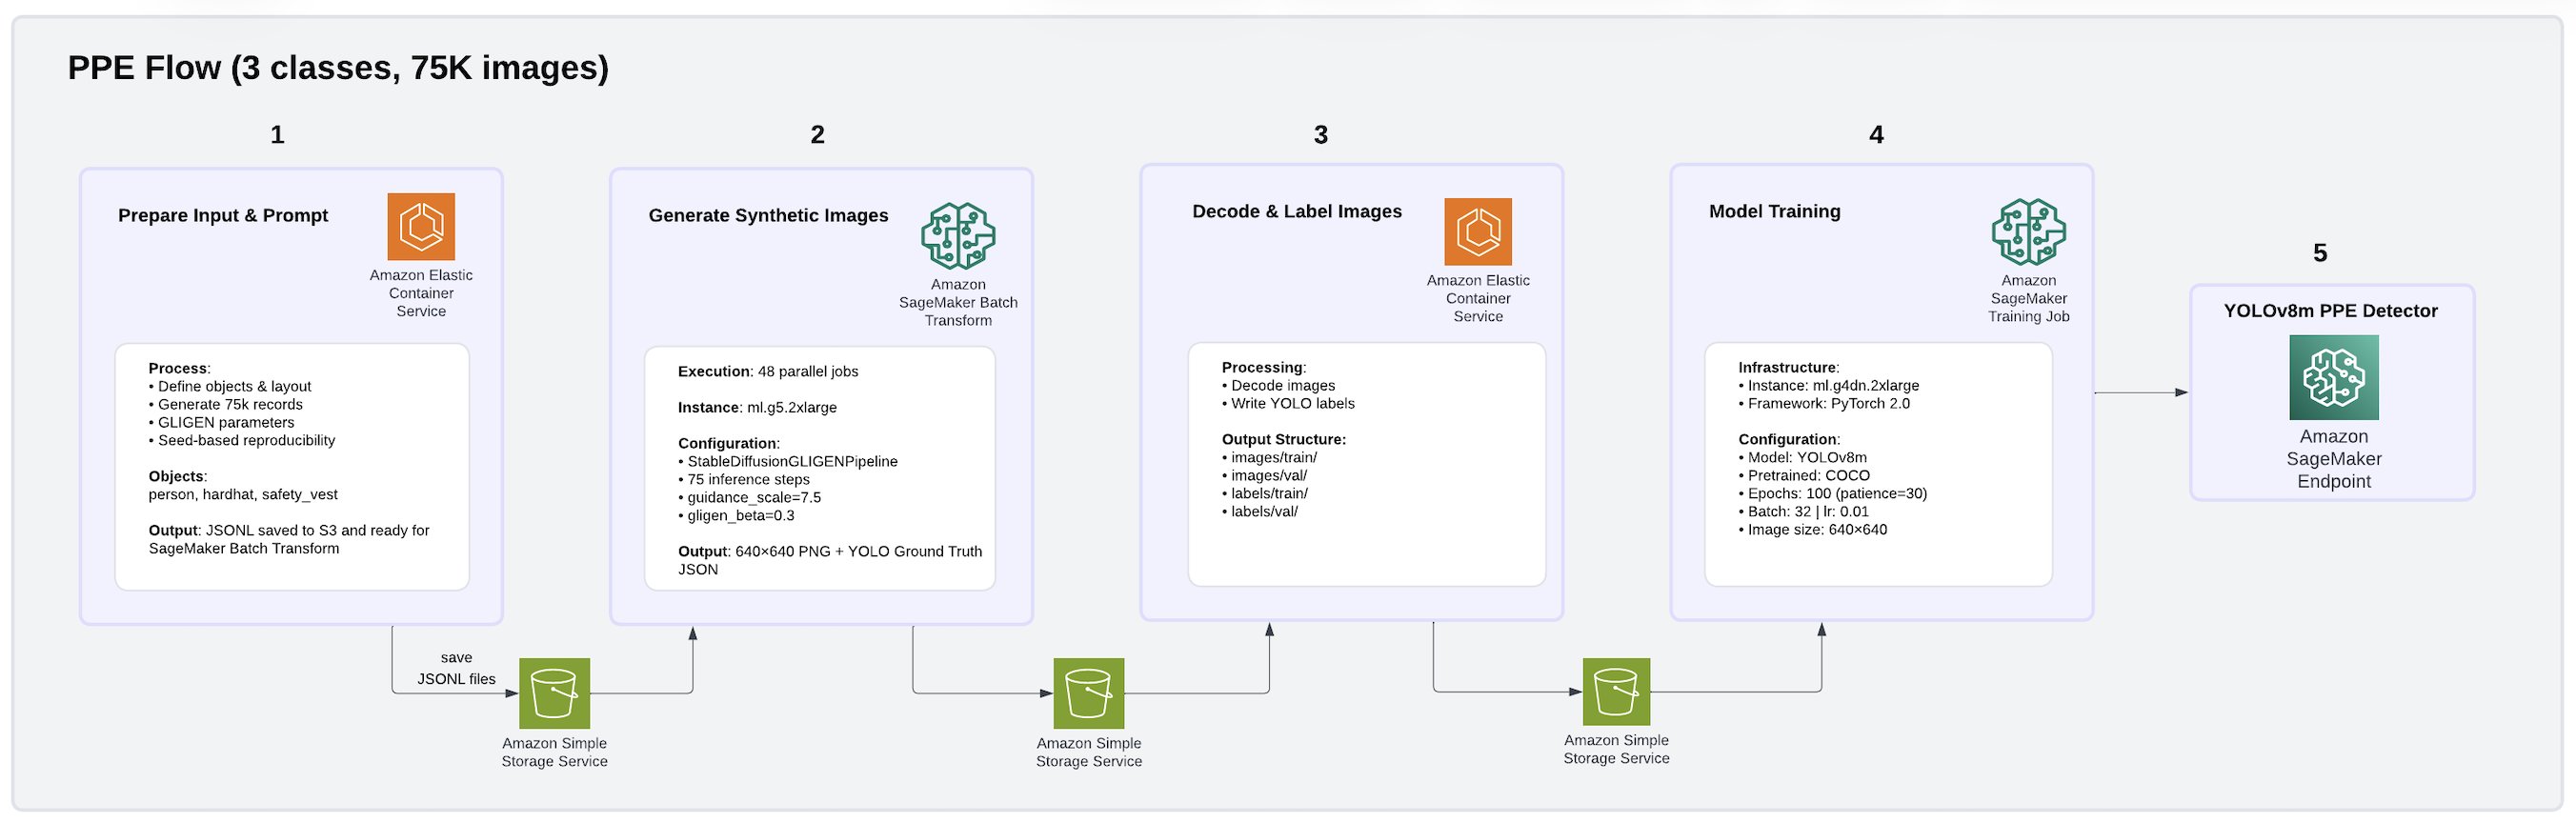
To address these challenges, we built a fully synthetic data generation and model training pipeline on AWS using GLIGEN (Grounded Language-to-Image Generation), a diffusion-based generative model deployed as Amazon SageMaker Batch Transform jobs. Using this approach, we produced a 75,000-image PPE dataset covering three classes: person, hard hat, and safety vest. The pipeline architecture is illustrated in the following image.
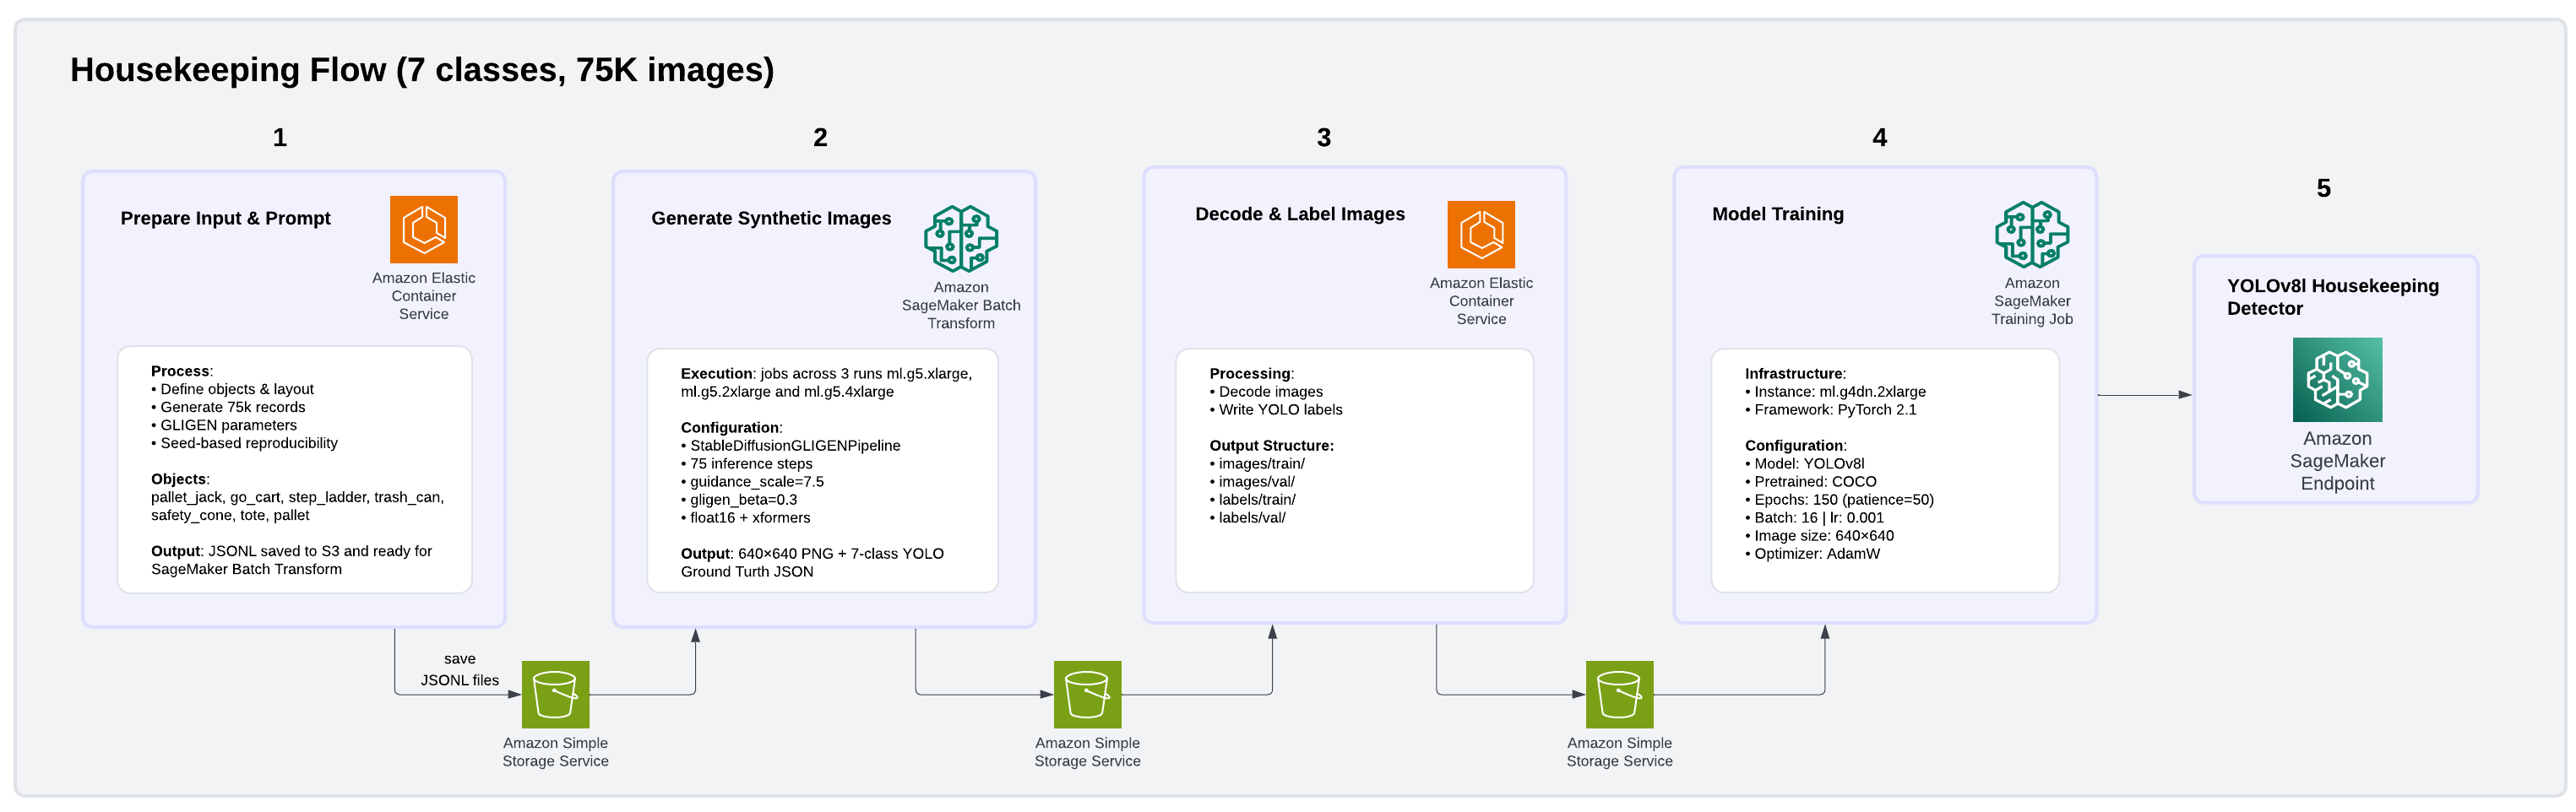
We also produced a 75,000-image Housekeeping dataset covering seven common facility object classes: pallet jack, go-cart, step ladder, trash can, safety cone, tote, and pallet. The pipeline architecture is illustrated in the following image.
GLIGEN enables the creation of highly realistic, yet controlled, training datasets that address both rare event scarcity and data diversity gaps without requiring manual image collection or annotation. For floor spills, GLIGEN receives structured bounding box inputs specifying where objects should appear, generating photorealistic facility scenes with spills or debris placed in realistic facility floor contexts. For PPE color diversity, GLIGEN generates images of workers wearing safety equipment in varied colors, creating the diversity needed for robust detection across acceptable variations. For each image, GLIGEN received bounding box coordinates specifying object positions and generated photorealistic 512×512 facility scenes with ground truth annotations automatically embedded in the output, avoiding manual labeling entirely. Raw outputs were streamed from Amazon S3, decoded, and converted to YOLO annotation format using parallel Python workers, then uploaded back to S3 as training-ready datasets. We trained YOLOv8 models on Amazon SageMaker AI using PyTorch 2.1, with the final configuration using cosine learning rate scheduling and AdamW optimization. This is a combination that proved critical for stabilizing the larger YOLOv8l model variant and preventing gradient divergence during training. Beyond training data generation, GLIGEN ‘s synthetic images also enhance the inference by reducing false positive risk detections and providing more accurate, contextual understanding of the operational environment.
Conclusion
Our solution demonstrates strong accuracy. For use cases trained entirely on synthetic data generated by GLIGEN, the PPE model achieved 99.5% mean average precision (mAP@50) with 100% precision and recall across all three classes. The Housekeeping model reached 94.3% mAP@50 with 91.4% precision and 86.9% recall across seven more challenging facility object classes, all without a single manually annotated real image. Accuracy can be further improved by increasing the volume of training images used to build and train the custom model. Beyond accuracy, through testing on 10,000 synthetic images, we’ve seen our solution perform strongly across two critical dimensions:
- speed of up to 37 seconds, measured by the time elapsed between an image captured and notification delivery to Zone Operators.
- scale across 10,000+ cameras, validated through simultaneous processing of 10,000 images, if one camera produces one frame at a time.
While this post focuses on our warehouse deployment, the architecture we’ve described is intentionally industry-agnostic. The core capabilities, object detection, zone-based spatial reasoning, temporal violation tracking, and privacy-preserving image processing, are not specific to a single environment. The same detection pipeline that identifies PPE violations and housekeeping hazards on a distribution center floor could be adapted to monitor equipment boundaries on manufacturing floors, enforce clean room protocols in laboratories, or track safety compliance on construction sites. Each industry requires a domain-specific model training, tailored business rules, and unique zone configurations, but the underlying event-driven architecture, scaling patterns, and intelligent alarm detection framework remain constant. We look forward to exploring these extensions in future work.
For more information about AWS workforce safety solutions, see Delivering an integrated approach to safety: How AWS Workforce Safety solutions make work safer.
About the authors
Author: Nika Mishurina