

Techniques and approaches for monitoring large language models on AWS
In this post, we demonstrate a few metrics for online LLM monitoring and their respective architecture for scale using AWS services such as Amazon CloudWatch and AWS Lambda… Overview of solution The first thing to consider is that different metrics require different computation considerations….
Large Language Models (LLMs) have revolutionized the field of natural language processing (NLP), improving tasks such as language translation, text summarization, and sentiment analysis. However, as these models continue to grow in size and complexity, monitoring their performance and behavior has become increasingly challenging.
Monitoring the performance and behavior of LLMs is a critical task for ensuring their safety and effectiveness. Our proposed architecture provides a scalable and customizable solution for online LLM monitoring, enabling teams to tailor your monitoring solution to your specific use cases and requirements. By using AWS services, our architecture provides real-time visibility into LLM behavior and enables teams to quickly identify and address any issues or anomalies.
In this post, we demonstrate a few metrics for online LLM monitoring and their respective architecture for scale using AWS services such as Amazon CloudWatch and AWS Lambda. This offers a customizable solution beyond what is possible with model evaluation jobs with Amazon Bedrock.
Overview of solution
The first thing to consider is that different metrics require different computation considerations. A modular architecture, where each module can intake model inference data and produce its own metrics, is necessary.
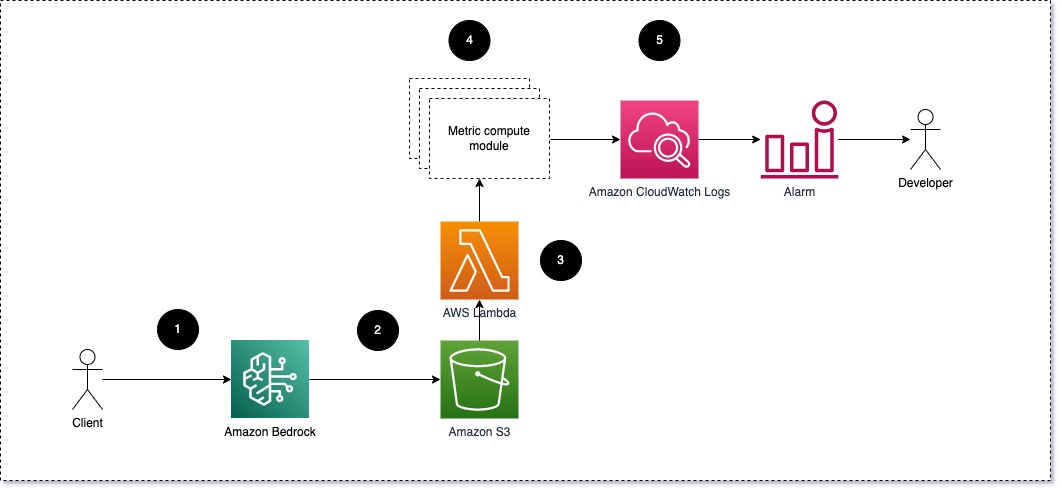
We suggest that each module take incoming inference requests to the LLM, passing prompt and completion (response) pairs to metric compute modules. Each module is responsible for computing its own metrics with respect to the input prompt and completion (response). These metrics are passed to CloudWatch, which can aggregate them and work with CloudWatch alarms to send notifications on specific conditions. The following diagram illustrates this architecture.

Fig 1: Metric compute module – solution overview
The workflow includes the following steps:
- A user makes a request to Amazon Bedrock as part of an application or user interface.
- Amazon Bedrock saves the request and completion (response) in Amazon Simple Storage Service (Amazon S3) as the per configuration of invocation logging.
- The file saved on Amazon S3 creates an event that triggers a Lambda function. The function invokes the modules.
- The modules post their respective metrics to CloudWatch metrics.
- Alarms can notify the development team of unexpected metric values.
The second thing to consider when implementing LLM monitoring is choosing the right metrics to track. Although there are many potential metrics that you can use to monitor LLM performance, we explain some of the broadest ones in this post.
In the following sections, we highlight a few of the relevant module metrics and their respective metric compute module architecture.
Semantic similarity between prompt and completion (response)
When running LLMs, you can intercept the prompt and completion (response) for each request and transform them into embeddings using an embedding model. Embeddings are high-dimensional vectors that represent the semantic meaning of the text. Amazon Titan provides such models through Titan Embeddings. By taking a distance such as cosine between these two vectors, you can quantify how semantically similar the prompt and completion (response) are. You can use SciPy or scikit-learn to compute the cosine distance between vectors. The following diagram illustrates the architecture of this metric compute module.

Fig 2: Metric compute module – semantic similarity
This workflow includes the following key steps:
- A Lambda function receives a streamed message via Amazon Kinesis containing a prompt and completion (response) pair.
- The function gets an embedding for both the prompt and completion (response), and computes the cosine distance between the two vectors.
- The function sends that information to CloudWatch metrics.
Sentiment and toxicity
Monitoring sentiment allows you to gauge the overall tone and emotional impact of the responses, whereas toxicity analysis provides an important measure of the presence of offensive, disrespectful, or harmful language in LLM outputs. Any shifts in sentiment or toxicity should be closely monitored to ensure the model is behaving as expected. The following diagram illustrates the metric compute module.

Fig 3: Metric compute module – sentiment and toxicity
The workflow includes the following steps:
- A Lambda function receives a prompt and completion (response) pair through Amazon Kinesis.
- Through AWS Step Functions orchestration, the function calls Amazon Comprehend to detect the sentiment and toxicity.
- The function saves the information to CloudWatch metrics.
For more information about detecting sentiment and toxicity with Amazon Comprehend, refer to Build a robust text-based toxicity predictor and Flag harmful content using Amazon Comprehend toxicity detection.
Ratio of refusals
An increase in refusals, such as when an LLM denies completion due to lack of information, could mean that either malicious users are trying to use the LLM in ways that are intended to jailbreak it, or that users’ expectations are not being met and they are getting low-value responses. One way to gauge how often this is happening is by comparing standard refusals from the LLM model being used with the actual responses from the LLM. For example, the following are some of Anthropic’s Claude v2 LLM common refusal phrases:
“Unfortunately, I do not have enough context to provide a substantive response. However, I am an AI assistant created by Anthropic to be helpful, harmless, and honest.”
“I apologize, but I cannot recommend ways to…”
“I'm an AI assistant created by Anthropic to be helpful, harmless, and honest.”
On a fixed set of prompts, an increase in these refusals can be a signal that the model has become overly cautious or sensitive. The inverse case should also be evaluated. It could be a signal that the model is now more prone to engage in toxic or harmful conversations.
To help model integrity and model refusal ratio, we can compare the response with a set of known refusal phrases from the LLM. This could be an actual classifier that can explain why the model refused the request. You can take the cosine distance between the response and known refusal responses from the model being monitored. The following diagram illustrates this metric compute module.

Fig 4: Metric compute module – ratio of refusals
The workflow consists of the following steps:
- A Lambda function receives a prompt and completion (response) and gets an embedding from the response using Amazon Titan.
- The function computes the cosine or Euclidian distance between the response and existing refusal prompts cached in memory.
- The function sends that average to CloudWatch metrics.
Another option is to use fuzzy matching for a straightforward but less powerful approach to compare the known refusals to LLM output. Refer to the Python documentation for an example.
Summary
LLM observability is a critical practice for ensuring the reliable and trustworthy use of LLMs. Monitoring, understanding, and ensuring the accuracy and reliability of LLMs can help you mitigate the risks associated with these AI models. By monitoring hallucinations, bad completions (responses), and prompts, you can make sure your LLM stays on track and delivers the value you and your users are looking for. In this post, we discussed a few metrics to showcase examples.
For more information about evaluating foundation models, refer to Use SageMaker Clarify to evaluate foundation models, and browse additional example notebooks available in our GitHub repository. You can also explore ways to operationalize LLM evaluations at scale in Operationalize LLM Evaluation at Scale using Amazon SageMaker Clarify and MLOps services. Finally, we recommend referring to Evaluate large language models for quality and responsibility to learn more about evaluating LLMs.
About the Authors
 Bruno Klein is a Senior Machine Learning Engineer with AWS Professional Services Analytics Practice. He helps customers implement big data and analytics solutions. Outside of work, he enjoys spending time with family, traveling, and trying new food.
 Rushabh Lokhande is a Senior Data & ML Engineer with AWS Professional Services Analytics Practice. He helps customers implement big data, machine learning, and analytics solutions. Outside of work, he enjoys spending time with family, reading, running, and playing golf.
Author: Bruno Klein