Is The Latest Surge In Stock Market Volatility Noise Or Signal?

The market looks set for a second-straight weekly decline… When market volatility is low, it’s only a matter of time before it rebounds, as it has in recent days… No, you can’t time the market based on this indicator, but it’s useful to put into the toolkit for managing expectations… On…
Two weeks ago I wrote: “US stocks look overbought,” based on a variety of metrics. Fast forward to yesterday’s close for the S&P 500 Index and equities are well below their recent peak. Dumb luck? Maybe, but the better question is whether the latest decline is the start of an extended slide or just a garden variety correction? Alas, no one knows the answer. Indeed, no one ever does. But we can review the basics for developing calculated-risk estimates.
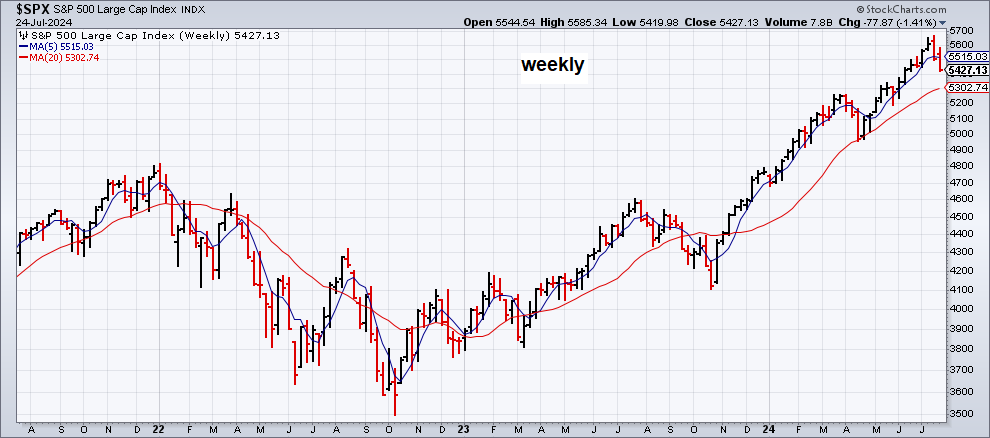
Let’s start by recognizing that the weekly profile of the S&P suggests that the current sell-off is noise. The market looks set for a second-straight weekly decline. Back-to-back weekly losses are about as unusual as finding stars in the sky.
What has been unusual, as discussed two weeks ago, is the S&P’s hot run for much of this year. As I noted on July 11, “the current reading [of the S&P 500 Sentiment Momentum Index] isn’t unprecedented, which leaves room for even higher prices, but a relatively high print is a reminder that we’re probably closer to a near-term top vs. anytime in the past three years.”
Another clue for thinking that equities, two weeks ago, had gone too far too fast: low volatility, as defined by the VIX Index. When market volatility is low, it’s only a matter of time before it rebounds, as it has in recent days. Round and round we go. No, you can’t time the market based on this indicator, but it’s useful to put into the toolkit for managing expectations.
The past is clear, but where does that leave us now? For some context, consider how the S&P’s 5-week moving average compares with its 20-week counterpart, as shown in the first chart above. There are many ways to profile trend, and this is one way to start. As a basic measure of which way the wind’s blowing it’s useful as a first approximation, albeit with its own unique set of pros and cons. On that basis, this profile suggests it’s premature to read too much into the market’s current slide.
Ditto for looking at the market’s drawdown. The S&P’s peak-to-trough decline is currently -4.2%. Anything above -5% is a statistical yawn since such events happen regularly.
But all this is meaningless without context from the investor’s perspective. Deciding how, or if, to adjust your portfolio should be highly influenced by several factors that are specific to you, starting with the key variables: investment time horizon and risk tolerance. With a clear-eyed view of where you stand on these points, you can decide if the current market conditions are noise or signal.
As I wrote earlier this month (July 7) in The ETF Portfolio Strategist, a sister publication of CapitalSpectator.com:
For conservative investors who can’t tolerate short-term risk — and are willing to forgo what could be substantial returns in the near term — the case for pulling back has merit. But if your risk tolerance is more or less average, or above average, and your time horizon is several years or longer, the technical profile for risk assets still look sufficiently bullish to stay the course.
A week later (July 14) I followed up, advising:
The question for most investors is whether there’s been too much of a good thing recently? The answer is almost certainly “yes” in the sense that the strong returns are borrowing from future performance. The bigger question is what, if anything, to do about it? That’s where the calculus gets tricky, mainly because the answer relies on the specifics of each investor.
The point is that there’s only one US stock market, but reading the tea leaves has many interpretations, depending on where a given investor sits on the time horizon/risk tolerance scale. What looks like noise to one investor may be highly significant to another.
It follows, then, that trying to provide generic advice that’s relevant to everyone is an effort that’s doomed to fail. Nonetheless, it’s still useful to keep an eye on market trends, but with the caveat that the results need to be refined through a process that customizes the analysis for each investor.
With that warning out of the way, here’s what I’ll be looking for in the days and weeks ahead. First, will the S&P’s latest slide continue to deteriorate? Again, there are many ways to run the numbers, but one way to begin is watching the 5-week average vs. the 20-week average. When the short average falls below its longer-term counterpart, that will attract my attention, and raise the question: Has the S&P’s broad momentum turned negative for the medium-term outlook?
At that point, assuming it arrives in the near term, it’ll be time to investigate further with an additional set of analytics. For now, assuming you’re not a short-term trader, the 5-week/20-week profile suggests that it’s premature to read too much into the latest decline.

Author: James Picerno


