Let’s Architect! Monitoring production systems at scale

When a system serves traffic in production, we need to monitor it to make sure it behaves as expected and that all components are healthy… But questions arise such as: How do we monitor a system? What is monitoring? What are some architectural and engineering approaches to implement in or…
“Everything fails, all the time” is a famous quote from Amazon’s Chief Technology Officer Werner Vogels. This means that software and distributed systems may eventually fail because something can always go wrong. We have to accept this and design our systems accordingly, test our software and services, and think about all the possible edge cases.
With this in mind, we should also set our teams up for success by providing visibility in every environment for a quick turnaround when incidents happen. When a system serves traffic in production, we need to monitor it to make sure it behaves as expected and that all components are healthy. But questions arise such as:
- How do we monitor a system?
- What is monitoring?
- What are some architectural and engineering approaches to implement in order to design a successful monitoring strategy?
All of these questions require complex answers. It’s not possible to cover everything in a blog post, but let’s start exploring the topic and sharing resources to guide you through this domain.
In this edition of Let’s Architect! we share some practices for monitoring used at Amazon and AWS, as well as more resources to discover how to build monitoring solutions for the workloads running on AWS.
Observability best practices at Amazon
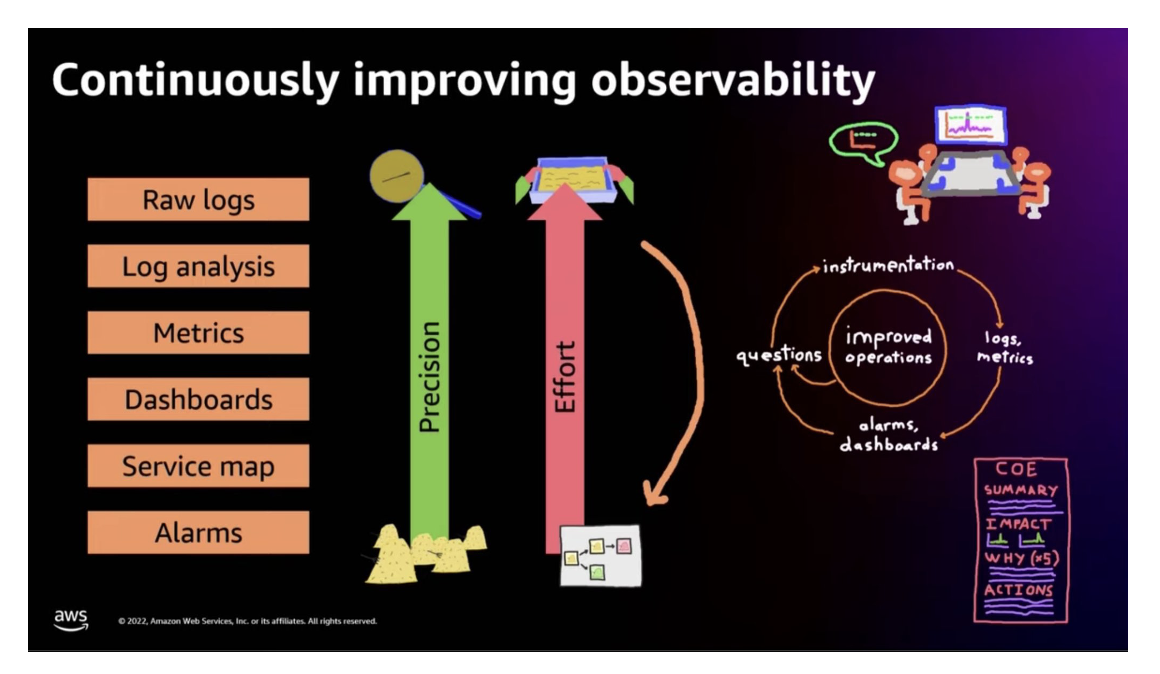
Observability and monitoring are engineering tasks that also require putting a suitable cultural mindset in place. At Amazon, if a service doesn’t run as expected, the team writes a CoE (Correction of Errors) document to analyze the issue and answer critical questions to learn from it. There are also weekly operations meetings to analyze operational and performance dashboards for each service.
The session introduced here covers the full range of monitoring at Amazon, from how teams assess system health at a high level to how they understand the details of a single request. Use this resource to learn some best practices for metrics, logs, and tracing, and using these signals to achieve operational excellence.
Take me to this re:Invent video!

Observability is an iterative process which requires us to establish a feedback loop and improve based on the signals coming from the system.
Build an observability solution using managed AWS services and the OpenTelemetry standard
Visibility of what’s happening in a distributed system is key to operationalize workloads at scale. OpenTelemetry is the standard for observability and AWS services are fully integrated with that. The blog post introduced in this section shows you how AWS Distro for OpenTelemetry (ADOT) works under the hood and how to use it with a Kubernetes cluster. But keep in mind, this is just one of the many implementations available for AWS compute services and OpenTelemetry—so even if you’re not using Kubernetes right now, we’ve still got you covered!
Want more? Watch this re:Invent video for an understanding of how to think about logging, tracing, metrics, and monitoring with AWS services, and the possibilities to provide the observability your distributed systems need. This is a great learning resource with many demos and examples.
Optimizing your AWS Batch architecture for scale with observability dashboards
We’ve explored the mental models and strategies for monitoring in previous resources. Now let’s see how these principles can be applied in a scenario where we run batch and ML computing jobs at scale. In the blog post introduced in this section, you can learn how to use runtime metrics to understand an architecture designed on AWS Batch for running batch computing jobs. AWS Batch is a fully managed service enabling you to run jobs at any scale without needing to manage underlying compute resources. This blog explains how AWS Batch works and guides you through the process used to design a monitoring framework.
Since the solution is open-source, you are free to add other custom metrics you find useful. To get started with the AWS Batch open-source observability solution, visit the project page on GitHub. Several customers have used this monitoring tool to optimize their workload for scale by reshaping their jobs, refining their instance selection, and tuning their AWS Batch architecture.

High-level structure of AWS Batch resources and interactions. This diagram depicts a user submitting jobs based on a job definition template to a job queue, which then communicates to a compute environment that resources are needed.
Observability workshop
This resource provides a hands-on experience for you on the variety of toolsets AWS offers to set up monitoring and observability on your applications. Whether your workload is on-premises or on AWS—or your application is a giant monolith or based on modern microservices-based architecture—the observability tools can provide deeper insights into application performance and health.
The monitoring tools covered in this workshop provide powerful capabilities that enable you to identify bottlenecks, issues, and defects without having to manually sift through various logs, metrics, and trace data.

The diagram illustrates the various components of the PetAdoptions architecture. In the workshop you will learn how to monitor this application.
See you next time!
Thanks for exploring architecture tools and resources with us!
Next time we’ll talk about containers on AWS.
To find all the posts from this series, check out the Let’s Architect! page of the AWS Architecture Blog.
Author: Vittorio Denti

