

Markets Are Decoupling Again, Based On Return Correlations

The benefits of diversifying across asset classes as a risk‑management tool are widely accepted, but what’s easily overlooked is that the relative benefits wax and wane over time… That doesn’t invalidate global asset allocation, but it does serve as a reminder that your mileage will vary… …
The benefits of diversifying across asset classes as a risk‑management tool are widely accepted, but what’s easily overlooked is that the relative benefits wax and wane over time. That doesn’t invalidate global asset allocation, but it does serve as a reminder that your mileage will vary.
There are several ways to measure asset allocation’s value for portfolio design and management. A useful first step is tracking how return correlations vary through time. In contrast with the popular approach of looking at a single snapshot and calling it a day, reviewing rolling numbers offers a more realistic profile of the dynamic nature of correlations, which in turn helps manage expectations for how global asset allocation will perform.
Let’s start with a top‑down review of the median correlation for all major asset classes using a rolling 1‑year window of daily data. The current reading is 0.42 (see chart below). As a recap, correlations range from –1.0 (perfect negative correlation) to +1.0 (perfect positive correlation). The latest value indicates a moderately low degree of positive correlation, which has fallen substantially from above 0.65 a few years ago. In other words, the implied benefits of diversification across major asset classes have strengthened. One could say that investors are getting more bang for the asset‑allocation buck lately.
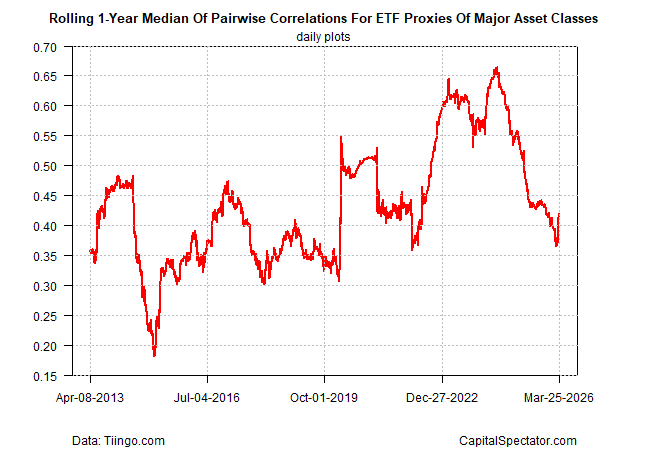
Keep in mind that a range of correlations is the basis for holding multiple asset classes. If everything was perfectly correlated, there would be no point in holding more than one asset.
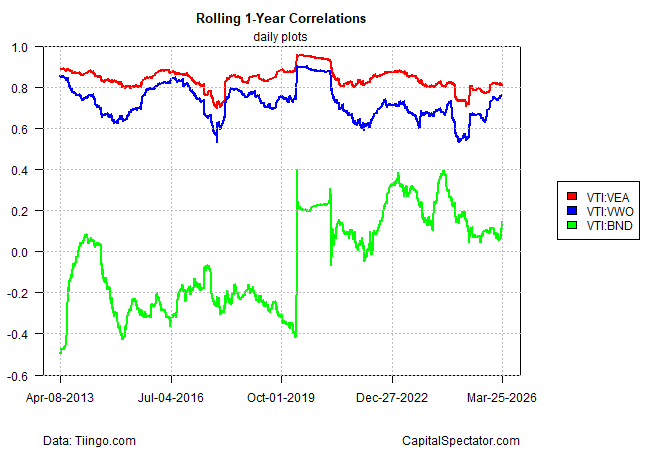
Back in the real world, the next chart focuses on how correlations have changed from the viewpoint of a US stock fund—in this case, Vanguard’s Total Stock Market ETF (VTI). The three lines compare VTI with equities in developed markets ex‑U.S. (VEA), emerging markets (VWO), and U.S. bonds (BND).
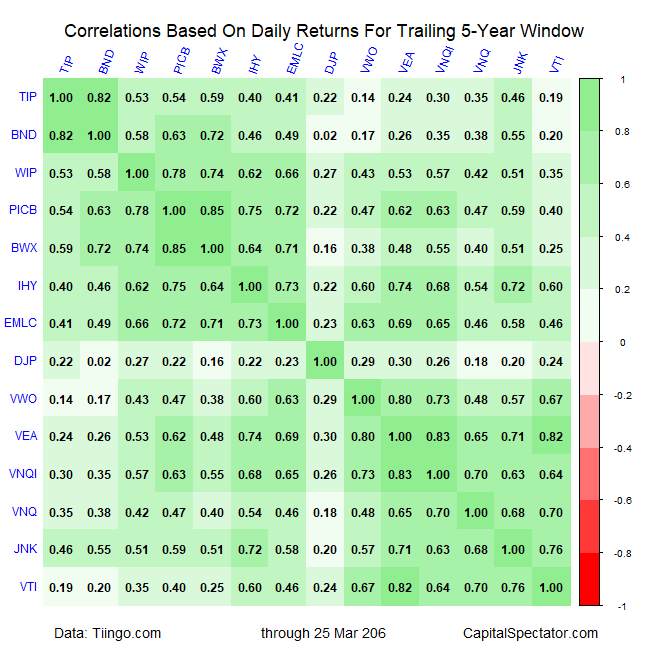
Drilling down further, the table below summarizes how correlations stack up over the trailing 5‑year window for all major asset classes. At the extremes, the results range from 0.02 for commodities (DJP) and U.S. bonds (BND) to 0.85 for government bonds in developed markets ex‑U.S. (BWX) and global corporate bonds ex‑US (PICB).
This type of analysis is just one piece of the puzzle, of course. A real-world plan might also consider expected returns for asset classes. Even more important: customizing the portfolio for the investor or institution to factor in the specific time horizon, risk tolerance, etc.
Correlations are a useful first step in designing a portfolio strategy, highlighting what’s available for risk management. Although the numbers will change, the concept of global asset allocation endures. Because the future is always unknowable, investing across asset classes is consistently beneficial. What isn’t fixed is the degree of the benefits on offer in any given period.
Learn To Use R For Portfolio Analysis
Quantitative Investment Portfolio Analytics In R:
An Introduction To R For Modeling Portfolio Risk and Return![]()
By James Picerno
Author: James Picerno