

Revisiting “Safe” Portfolio Withdrawal Rates For Retirement
Bill Bengen, a financial planner, forged an industry standard in 1994 for thinking about “safe” withdrawal rates for investment portfolios during retirement… In a recent book, the father of the 4% rule has updated his research and now estimates that a safe withdrawal rate is higher than he ori…
Bill Bengen, a financial planner, forged an industry standard in 1994 for thinking about “safe” withdrawal rates for investment portfolios during retirement. His so-called 4% rule provided a quantitative framework for what had been mostly ad-hoc analysis up to that point. In a recent book, the father of the 4% rule has updated his research and now estimates that a safe withdrawal rate is higher than he originally reported.
As Morningstar notes, a key factor in his upward revision is related to rethinking asset allocation. By increasing diversification, along with changing other assumptions, his estimate of a safe withdrawal rate has increased from 4.15% to 4.7%, and perhaps even higher, depending on the investor
That’s where the crucial risk lies: Every investor is different. Because no two financial situations are identical, it’s crucial to customize a withdrawal strategy to match a range of assumptions and conditions, such as age, risk tolerance, market forecasts, and so on. Bengen’s book is a valuable start for thinking about how to plan for withdrawals, but ultimately everyone needs to adjust the generic advice.
The one point that everyone can agree on: the analysis is multi-faceted and doesn’t easily lend itself to one-size-fits-all modeling. Although no one can reliably predict the future, spending time understanding how assumptions influence results is a solid first step.
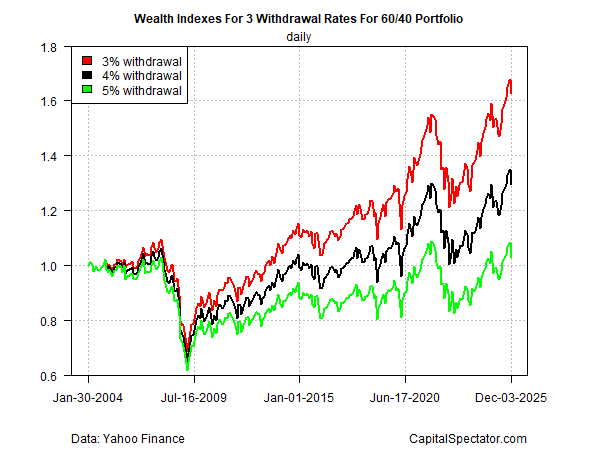
With that in mind, consider how changing the withdrawal rate affects portfolio value. As a toy example, let’s say you built a 60% stocks/40% bonds portfolio on Jan. 30, 2004, using two ETFs – SPDR S&P 500 (SPY) and the iShares Aggregate Bond Index (AGG). Adjusting the share removed from the portfolio at the end of each year has the expected result.

History is a guide, but only partially because it’s never clear if the future will be similar or radically different. To get a handle on how the path ahead could shift it’s useful to run simulations on what could happen. There are many ways to run simulations, but in the interest of brevity let’s look at one basic test. The graph below shows 10,000 sims that resample the actual returns from the 4% withdrawal index above. The main takeaway: actual results over the next 30 years could vary significantly vs. recent history. For example, the median value of the portfolio in this simple analysis shows that the value of the investments falls to 45% of the starting value.

There are, of course, many adjustments you could make to skew the results in your favor. The obvious ones include:
- dynamically changing the withdrawal rate based on market conditions
- opportunistically adjusting the asset allocation through time
- changing spending habits depending on market result
Another crucial variable is deciding how much of the portfolio should remain at the investor’s death. For some folks, spending everything is reasonable. For others, passing on a significant share of the portfolio’s starting wealth to heirs is essential.
Factoring in preferences and expectations opens the door to a wide variety of customized plans. What works for one investor will inevitably look ugly to another. As a result, crunching the numbers and carefully thinking through the possibilities and risks is essential. Reading Bengen’s book, and other literature, can help.
In the end you’ll need to develop a plan that’s right for you, either by doing a deep dive yourself or working with an adviser. Rules of thumb are useful as a baseline, but most investors need to go further.
The one exception: wealthy individuals who probably will die rich no matter what they do. For the rest of us, thoughtfully gaming out scenarios and assumptions is critical.

Author: James Picerno