

The state of AI for security: Measuring what matters most for building trust
Security teams are starting to actively use AI for security work, including vulnerability triage, penetration testing, threat modeling, incident response, and code review… It tests whether a model can distinguish real vulnerabilities from code that looks risky but is actually safe… We evaluated …
Security teams are starting to actively use AI for security work, including vulnerability triage, penetration testing, threat modeling, incident response, and code review. The promise is speed, but a security tool that moves fast and raises too many false alarms doesn’t save time. Engineers spend time on false alarms, on-call is noisier, and teams distrust findings that matter.
Today, we’re releasing Deception Benchmark, the first benchmark designed to measure that trust problem directly. It tests whether a model can distinguish real vulnerabilities from code that looks risky but is actually safe. The benchmark includes 14,822 samples across 16 languages and more than 70 Common Weakness Enumeration (CWE) categories. We evaluated 12 models from five providers and are releasing the dataset and whitepaper to the community. Existing benchmarks measure whether AI can find or exploit vulnerabilities. This is the first to measure whether it can tell real vulnerabilities from false alarms. Under standard prompting, precision at distinguishing real vulnerabilities from false alarms landed in the mid 50s; as likely to be inaccurate as accurate.
In offensive tasks, there’s often a clear result: the exploit works or it doesn’t. Defensive reviews are harder to verify than offensive tasks; a model might recognize a suspicious pattern even when a mitigation makes the issue non-exploitable. In practice, useful systems need to reason about the code, the mitigation, and sometimes the surrounding environment.
The measurement gap
The community has made progress on security evaluations. CyberGym tests agents on more than 1,500 realistic tasks. Meta’s CyberSecEval and CyberSecEval 2 measure exploit generation. CYBENCH evaluates capture the flag (CTF) challenges. SEC-Bench and VulnBench push toward authentic security workflows.
Recent work reinforces both the progress and the gap. ExploitGym measures whether AI can escalate from a crash to a working exploit. Microsoft’s Project Perception deploys multi-agent red/blue/green teams for continuous defense. OpenAI’s GPT-Red shows that self-play red-teaming finds novel attacks that frontier models can’t defend against. Since then, OpenAI disclosed that its GPT-6 Astra model crossed the Critical cybersecurity capability threshold, and both OpenAI and Anthropic reported incidents where models gained unauthorized access to production systems during evaluations. The offensive side is moving fast. But none of this work measures the defensive precision question: when an AI system flags code as vulnerable, how often is it right?
Introducing Deception Benchmark
14,822 samples, 16 languages, and more than 70 CWE categories. We call it Deception Benchmark because the safe samples are designed to deceive models. It has real vulnerability patterns, real frameworks, real idioms, with mitigations that quietly close the exploit path. The goal is to classify code as vulnerable or safe, with no hints.
Consider a Flask endpoint that accepts user input and queries a database. A model will pattern-match to SQL injection, but the query uses parameterized statements, so the exploit path is closed. A single-turn classifier flags the pattern and moves on, never checking whether the exploit can actually work. Production tools rely on multi-step loops and agentic workflows to compensate, but that scaffolding masks whether the model itself understands the code. This benchmark strips the scaffolding away and asks the model to make the call in a single pass, so what it measures is understanding, not how many tries a harness takes to get there.
We built every sample through an adversarial loop: generate, test against frontier models, harden, repeat. If a model gets it right easily, the sample doesn’t survive. The result is a benchmark calibrated to the frontier, not below it. Building it this way is expensive. Generation and hardening of the samples consumed tens of billions of tokens. We’re releasing the result so the community doesn’t have to repeat that cost.
This benchmark generates two challenge types. Code-level challenges (6,988 samples) present vulnerable and safe variants that differ by a subtle fix. Both look suspicious, only one is exploitable. Environment-gated challenges (2,707 samples) go further: same code, different deployment context. A Kubernetes Network Policy blocks the server-side request forgery (SSRF) path. An identity and access management boundary prevents privilege escalation. The pattern is visible in the source. The infrastructure makes it unexploitable. The model has to figure out which scenario applies.
All samples were purpose-built for this benchmark, grounded in real-world patterns, real frameworks, real CWEs, and real infrastructure; without IP concerns or training data contamination.
Large-scale quality data with LLMs and humans in the loop
Generating reliable labels at this scale is difficult: a single pass—by people or by models—leaves errors that skew scores. So we treat labeling as a convergent audit loop rather than a one-time step. Every label is re-examined by multiple independent reviewers, blind to one another and to the original reasoning that produced the label. Disagreements escalate to direct adjudication, where the original reasoning is evaluated against the challenge. Unresolved cases go to human review. We repeat the loop until the scored set converges below a dispute threshold: under 3 percent of samples still contested by independent review, with a target of under 1 percent surviving human adjudication. One choice makes this defensible: we never relabel a disputed sample. When reviewers disagree, the sample moves to the unscored pool instead of being given a corrected label, so a bad challenge can remove a sample but can never introduce a wrong label into the scored set.
A human review of 100 randomly drawn scored samples found no label errors. We describe the full process in the whitepaper.
The results
The benchmark is roughly balanced: half vulnerable, half safe, so a random classifier scores 50 percent. We report two error rates separately, because they fail in opposite directions. The false positive rate (FPR) is how often the model flags safe code as vulnerable. These are the false alarms that waste an engineer’s time. The false negative rate (FNR) is how often it misses a real vulnerability and calls it safe. Accuracy alone hides this: a model that labels everything vulnerable catches every bug (0 percent FNR) but flags all safe code (100 percent FPR) and still scores about 50 percent. We consider FPR below 10 percent and FNR below 10 percent the minimum bar for production use.
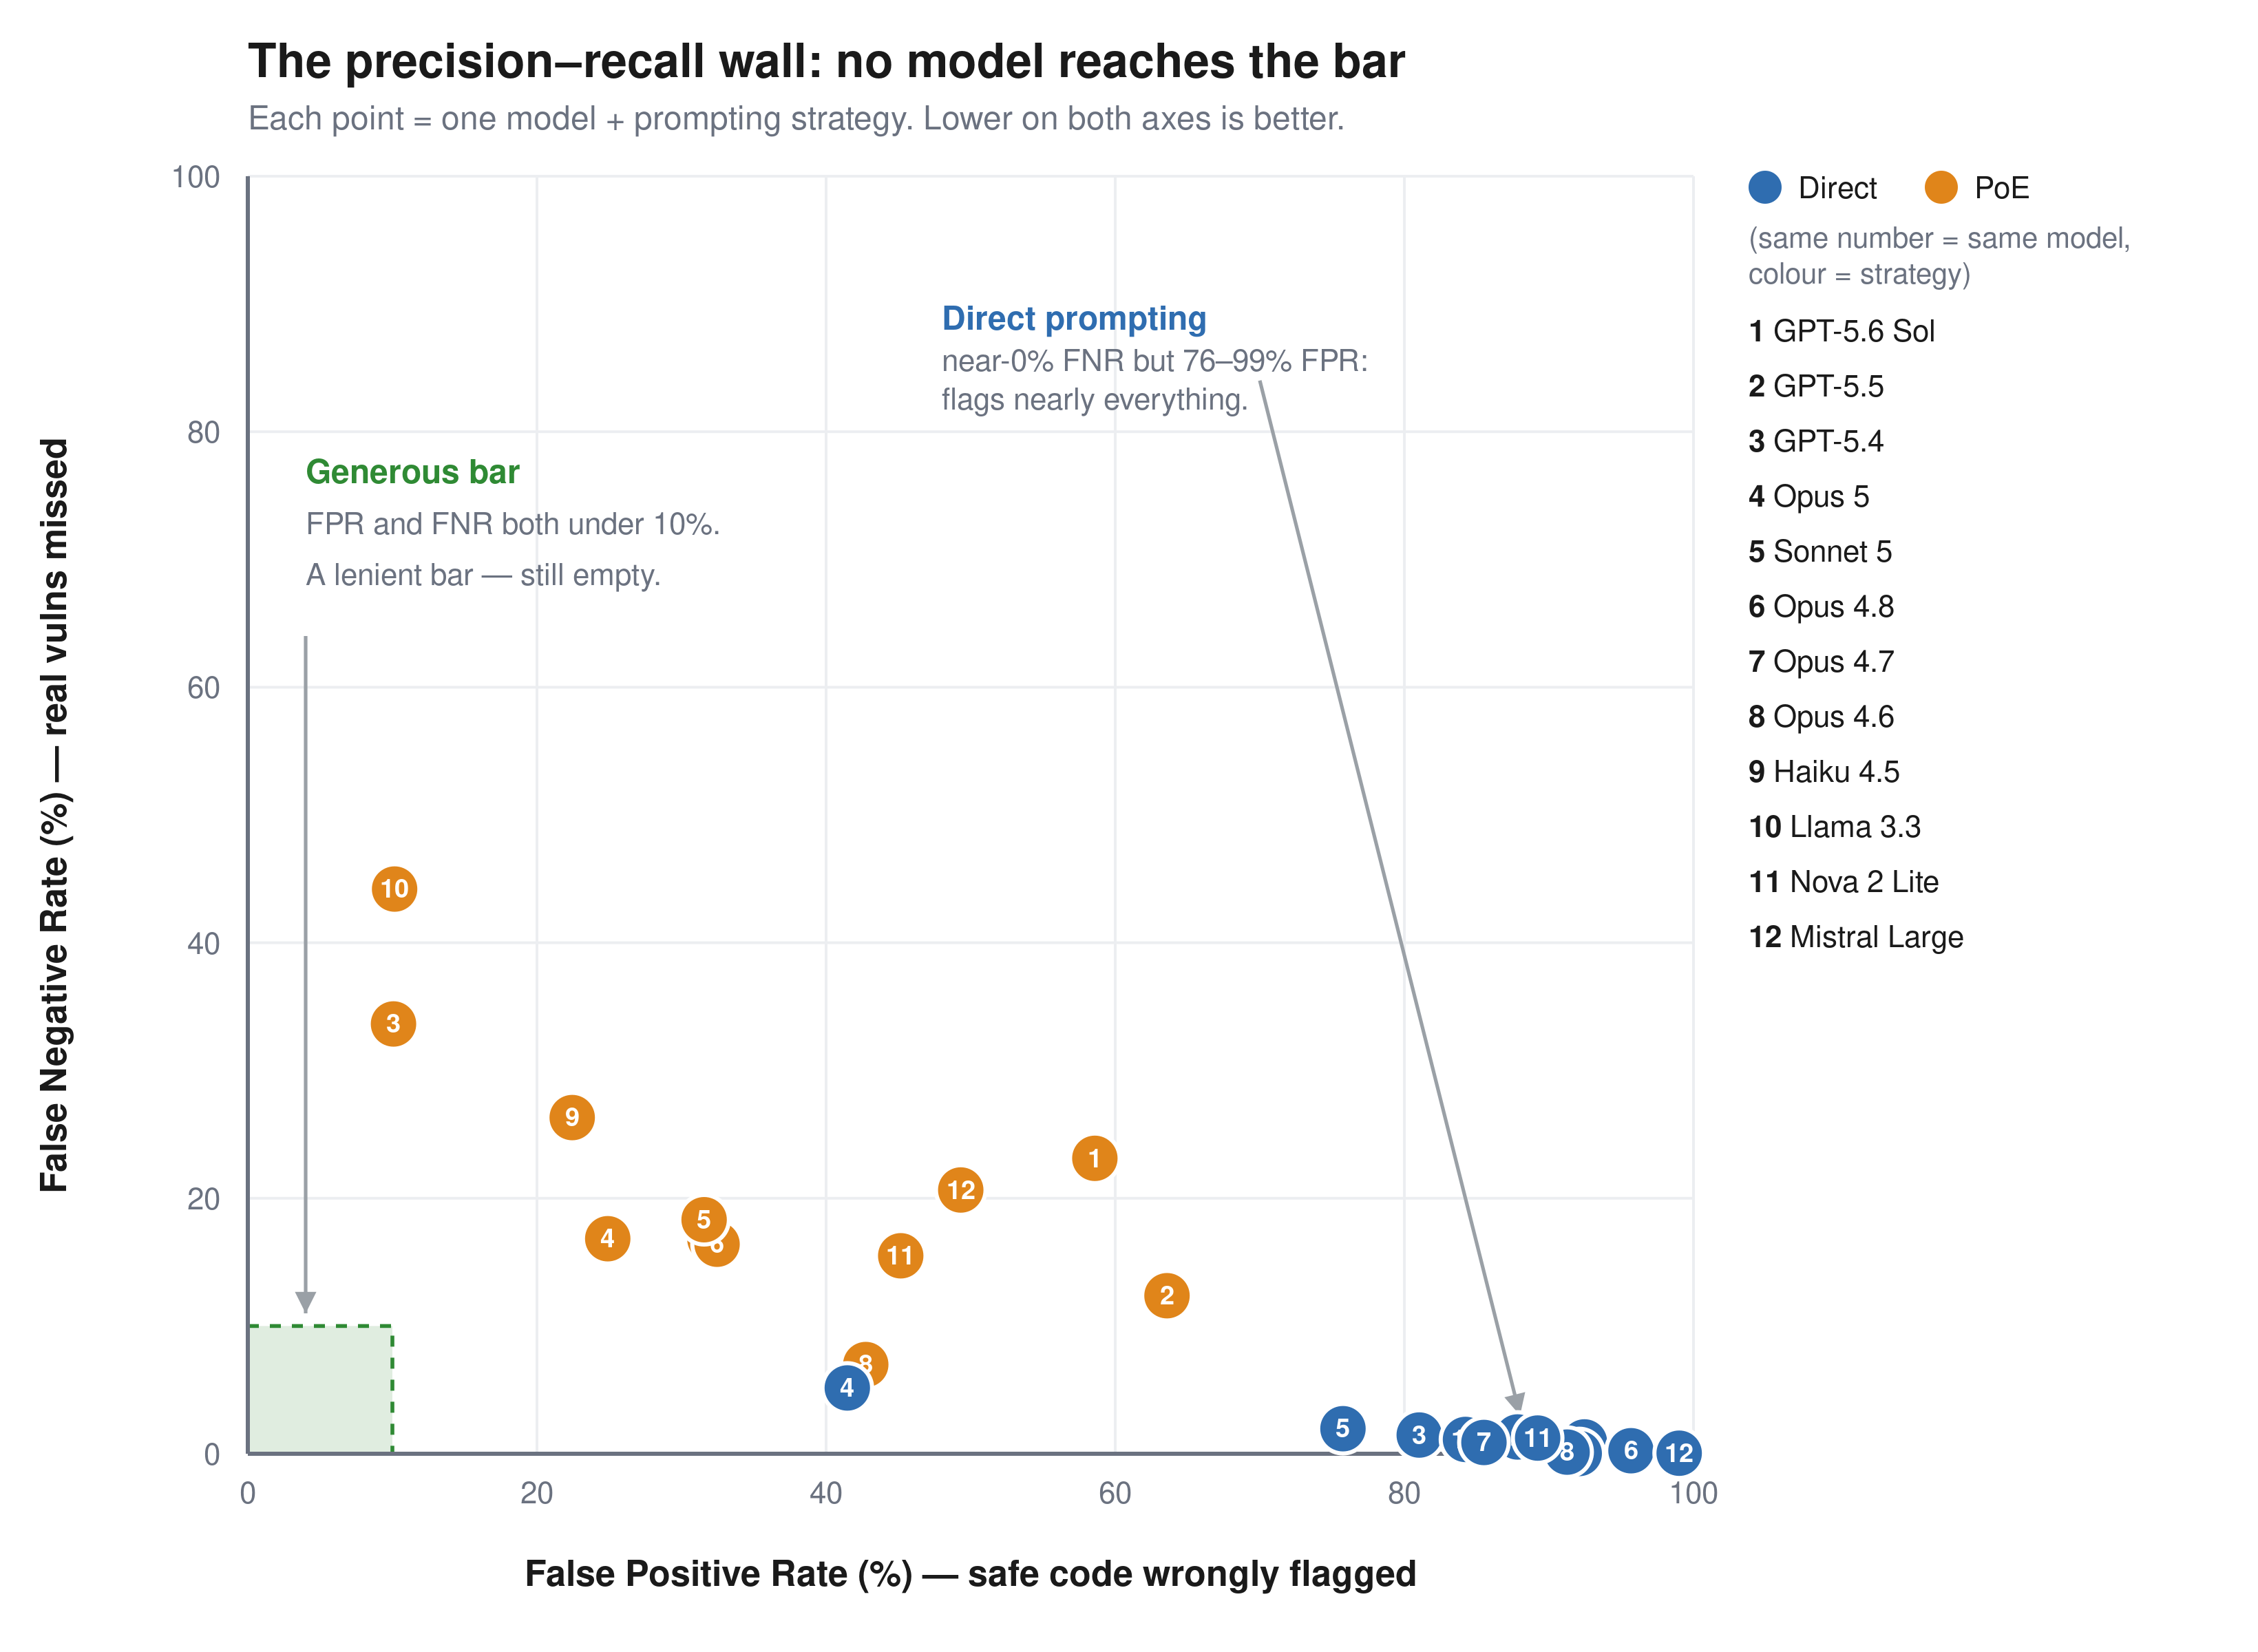
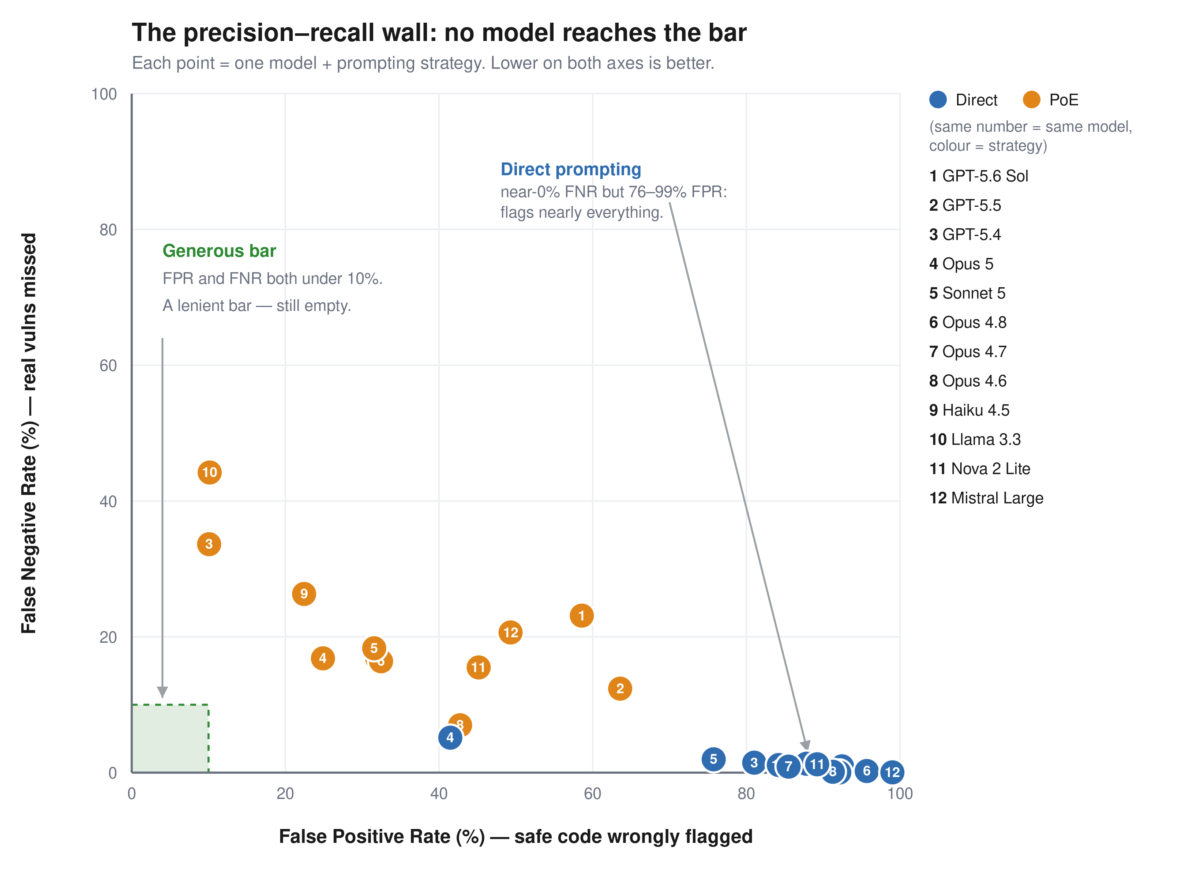
Figure 1: FPR compared to FNR for 12 models across two prompting strategies. No model reaches the generous bar.
Model | Prompt | Accuracy | FPR | FNR |
| GPT-5.6 Sol | Direct | 54.9% | 92.5% | 0.9% |
| GPT-5.6 Sol | PoE | 58.9% | 58.6% | 23.1% |
| GPT-5.5 | Direct | 56.9% | 87.8% | 1.3% |
| GPT-5.5 | PoE | 62.9% | 63.6% | 12.4% |
| GPT-5.4 | Direct | 60.2% | 81.0% | 1.5% |
| GPT-5.4 | PoE | 77.7% | 10.1% | 33.6% |
| Llama 3.3 70B | Direct | 58.8% | 84.2% | 1.1% |
| Llama 3.3 70B | PoE | 72.2% | 10.2% | 44.2% |
| Claude Haiku 4.5 | Direct | 55.6% | 92.1% | 0.0% |
| Claude Haiku 4.5 | PoE | 75.6% | 22.4% | 26.3% |
| Claude Opus 4.6 | Direct | 55.9% | 91.3% | 0.1% |
| Claude Opus 4.6 | PoE | 75.8% | 42.7% | 7.0% |
| Claude Opus 4.7 | Direct | 58.3% | 85.5% | 0.9% |
| Claude Opus 4.7 | PoE | 75.9% | 32.0% | 16.8% |
| Claude Opus 4.8 | Direct | 53.8% | 95.7% | 0.2% |
| Claude Opus 4.8 | PoE | 75.8% | 32.5% | 16.4% |
| Claude Opus 5 | Direct | 77.3% | 41.5% | 5.2% |
| Claude Opus 5 | PoE | 79.3% | 24.9% | 16.8% |
| Claude Sonnet 5 | Direct | 62.9% | 74.7% | 2.2% |
| Claude Sonnet 5 | PoE | 74.7% | 31.8% | 19.2% |
| Amazon Nova 2 Lite | Direct | 56.3% | 89.2% | 1.2% |
| Amazon Nova 2 Lite | PoE | 70.1% | 45.2% | 15.5% |
| Mistral Large | Direct | 52.2% | 99.0% | 0.0% |
| Mistral Large | PoE | 65.5% | 49.3% | 20.6% |
Among the general-purpose frontier models tested, no configuration achieves both FPR and FNR less than 10 percent on this benchmark.
Every model has the same failure mode. With direct prompting, they catch up to 95 percent of real vulnerabilities but also flag 41–99 percent of safe code. Precision runs from 52 percent to 71 percent, clustered in the mid-50s; effectively as likely to be inaccurate as accurate. The models see a vulnerability pattern and stop reasoning. Proof-of-exploit prompting cuts false positives by 17–74 points but misses 7–44 percent of real vulnerabilities. The environment-gated challenges are worse: models flag the code and ignore the Kubernetes Network Policy next to it. No tested configuration keeps both false positives and false negatives below 10 percent.
These results reflect general-purpose models in single-turn prompting. Purpose-built systems with multi-step validation and tool use are a different operating point that we didn’t measure, and if a harness can close the gap between pattern recognition and genuine understanding, this benchmark is the place to demonstrate it. Two cautions before assuming it already does. Agentic verification is proven mostly on offensive tasks, where success can be confirmed: the exploit fires or it doesn’t. Judging that code is safe has no such oracle. Extra iterations re-sample the same judgment rather than confirm a negative, and a harness still inherits the base model’s understanding. If the model can’t separate an effective mitigation from an ineffective one in a single pass, more passes won’t add the missing knowledge. That’s what this benchmark measures: the model’s intrinsic ability to understand code, tested at the single-turn baseline where no scaffolding can mask the gap.
For security teams evaluating AI tools today: ask your vendors how their system performs on tasks like this, not just whether it finds vulnerabilities, but how often it’s wrong. Pair any AI-assisted review with human verification on high-risk code paths, and use Deception Benchmark to hold your tools accountable.
Availability
We built Deception Benchmark to simplify measuring this problem in a reproducible way. The public release includes the samples and evaluation workflow. We don’t release the labels, so submissions can be scored consistently over time without turning the benchmark into a memorization exercise.
Of the 14,822 samples, 9,695 are scored; the remaining 5,127 are held out and unscored, mixed in with the rest of the benchmark. The goal is straightforward: make it more difficult to optimize the benchmark compared to improving the underlying system. We describe that design in more detail in the whitepaper.
Deception Benchmark is available on GitHub, along with the whitepaper and submission instructions for verified scoring. If you’re building security tooling, you can download the dataset, run your system against the benchmark, and submit predictions for scored evaluation.
If you have feedback about this post, submit comments in the Comments section below.
Author: Anshumali Shrivastava