

What Does Today’s Yield Curve Suggest for a Bond Ladder?
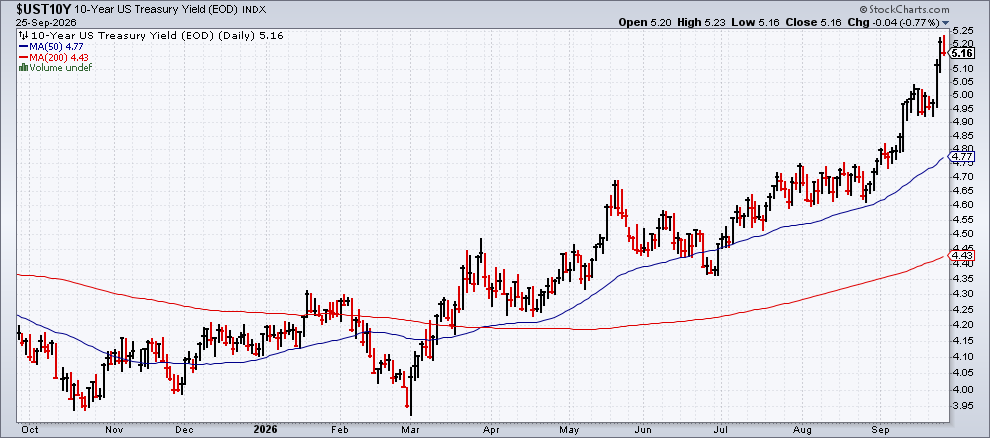
US Treasury yields continued to rise last week, and the trend profile suggests we haven’t seen the peak yet… The benchmark 10-year yield, for example, increased for a fourth straight week, closing on Friday at 5…The factors driving yields higher, including inflation concerns, a hawkish Fed, …
US Treasury yields continued to rise last week, and the trend profile suggests we haven’t seen the peak yet. The benchmark 10-year yield, for example, increased for a fourth straight week, closing on Friday at 5.16%, just below the highest level since 2007.
The factors driving yields higher, including inflation concerns, a hawkish Fed, and US fiscal risk, are likely to remain in play in the near term, if not longer. Meanwhile, the yield trend continues to point to higher levels over the near term. Until yields begin to consolidate within a range, technical signals continue to favor higher rates ahead.
A practical way to manage risk in a rising-yield environment is to reduce the need for forecasting. A bond ladder holds a range of maturities rather than concentrating exposure at a single point on the yield curve. As shorter-term bonds mature at regular intervals, the proceeds can be reinvested at prevailing interest rates, allowing investors to adapt to changing market conditions without having to anticipate future moves in yields or the broader market.
The key challenge with a ladder is deciding how to structure the maturity range and weighting. There are no simple answers, since a number of investor-specific variables come into play, including risk tolerance, investment objectives, and time horizon. A strategy that targets maturities of one through 10 years will carry less risk than a range of one through 30 years, although the latter may provide a higher yield and total return.
A baseline strategy is to simply equal-weight maturities across the selected range. There are several advantages, including transparency, diversification, sidestepping timing risk, and a clear set of rebalancing rules. The drawbacks include ignoring information embedded in the yield curve, which can lead to weaker results relative to a more sophisticated strategy that responds to changing market conditions.
As one example of a more adaptive ladder strategy, an investor can favor maturities with the most attractive yield-for-risk tradeoff based on current conditions by comparing duration with yield. The goal is to tilt the ladder toward the best balance between yield and interest-rate sensitivity.
There are many alternatives to this simple formulation, including countless models that seek to optimize a ladder based on a given set of variables. One of the more popular frameworks is the standard Nelson-Siegel (NS) model, which analyzes the yield curve through three lenses: its overall level, slope, and curvature. When applied to a bond ladder, those factors help identify which maturities currently offer the most attractive balance of yield and interest-rate risk, providing a systematic framework for allocating capital across the curve.
There are multiple ways to customize NS to reflect a particular set of preferences and assumptions. In the interest of monitoring the Treasury curve, here’s a setup I’ll periodically update to provide perspective on how yield-curve signals are evolving. In this version, the modeling seeks to quantitatively answer the question: How should I structure a bond ladder to optimize for current conditions? The key assumption is that the recent shape of the yield curve is a reasonable proxy for how bonds will behave going forward, based on NS modeling. The goal is primarily risk allocation rather than return forecasting.
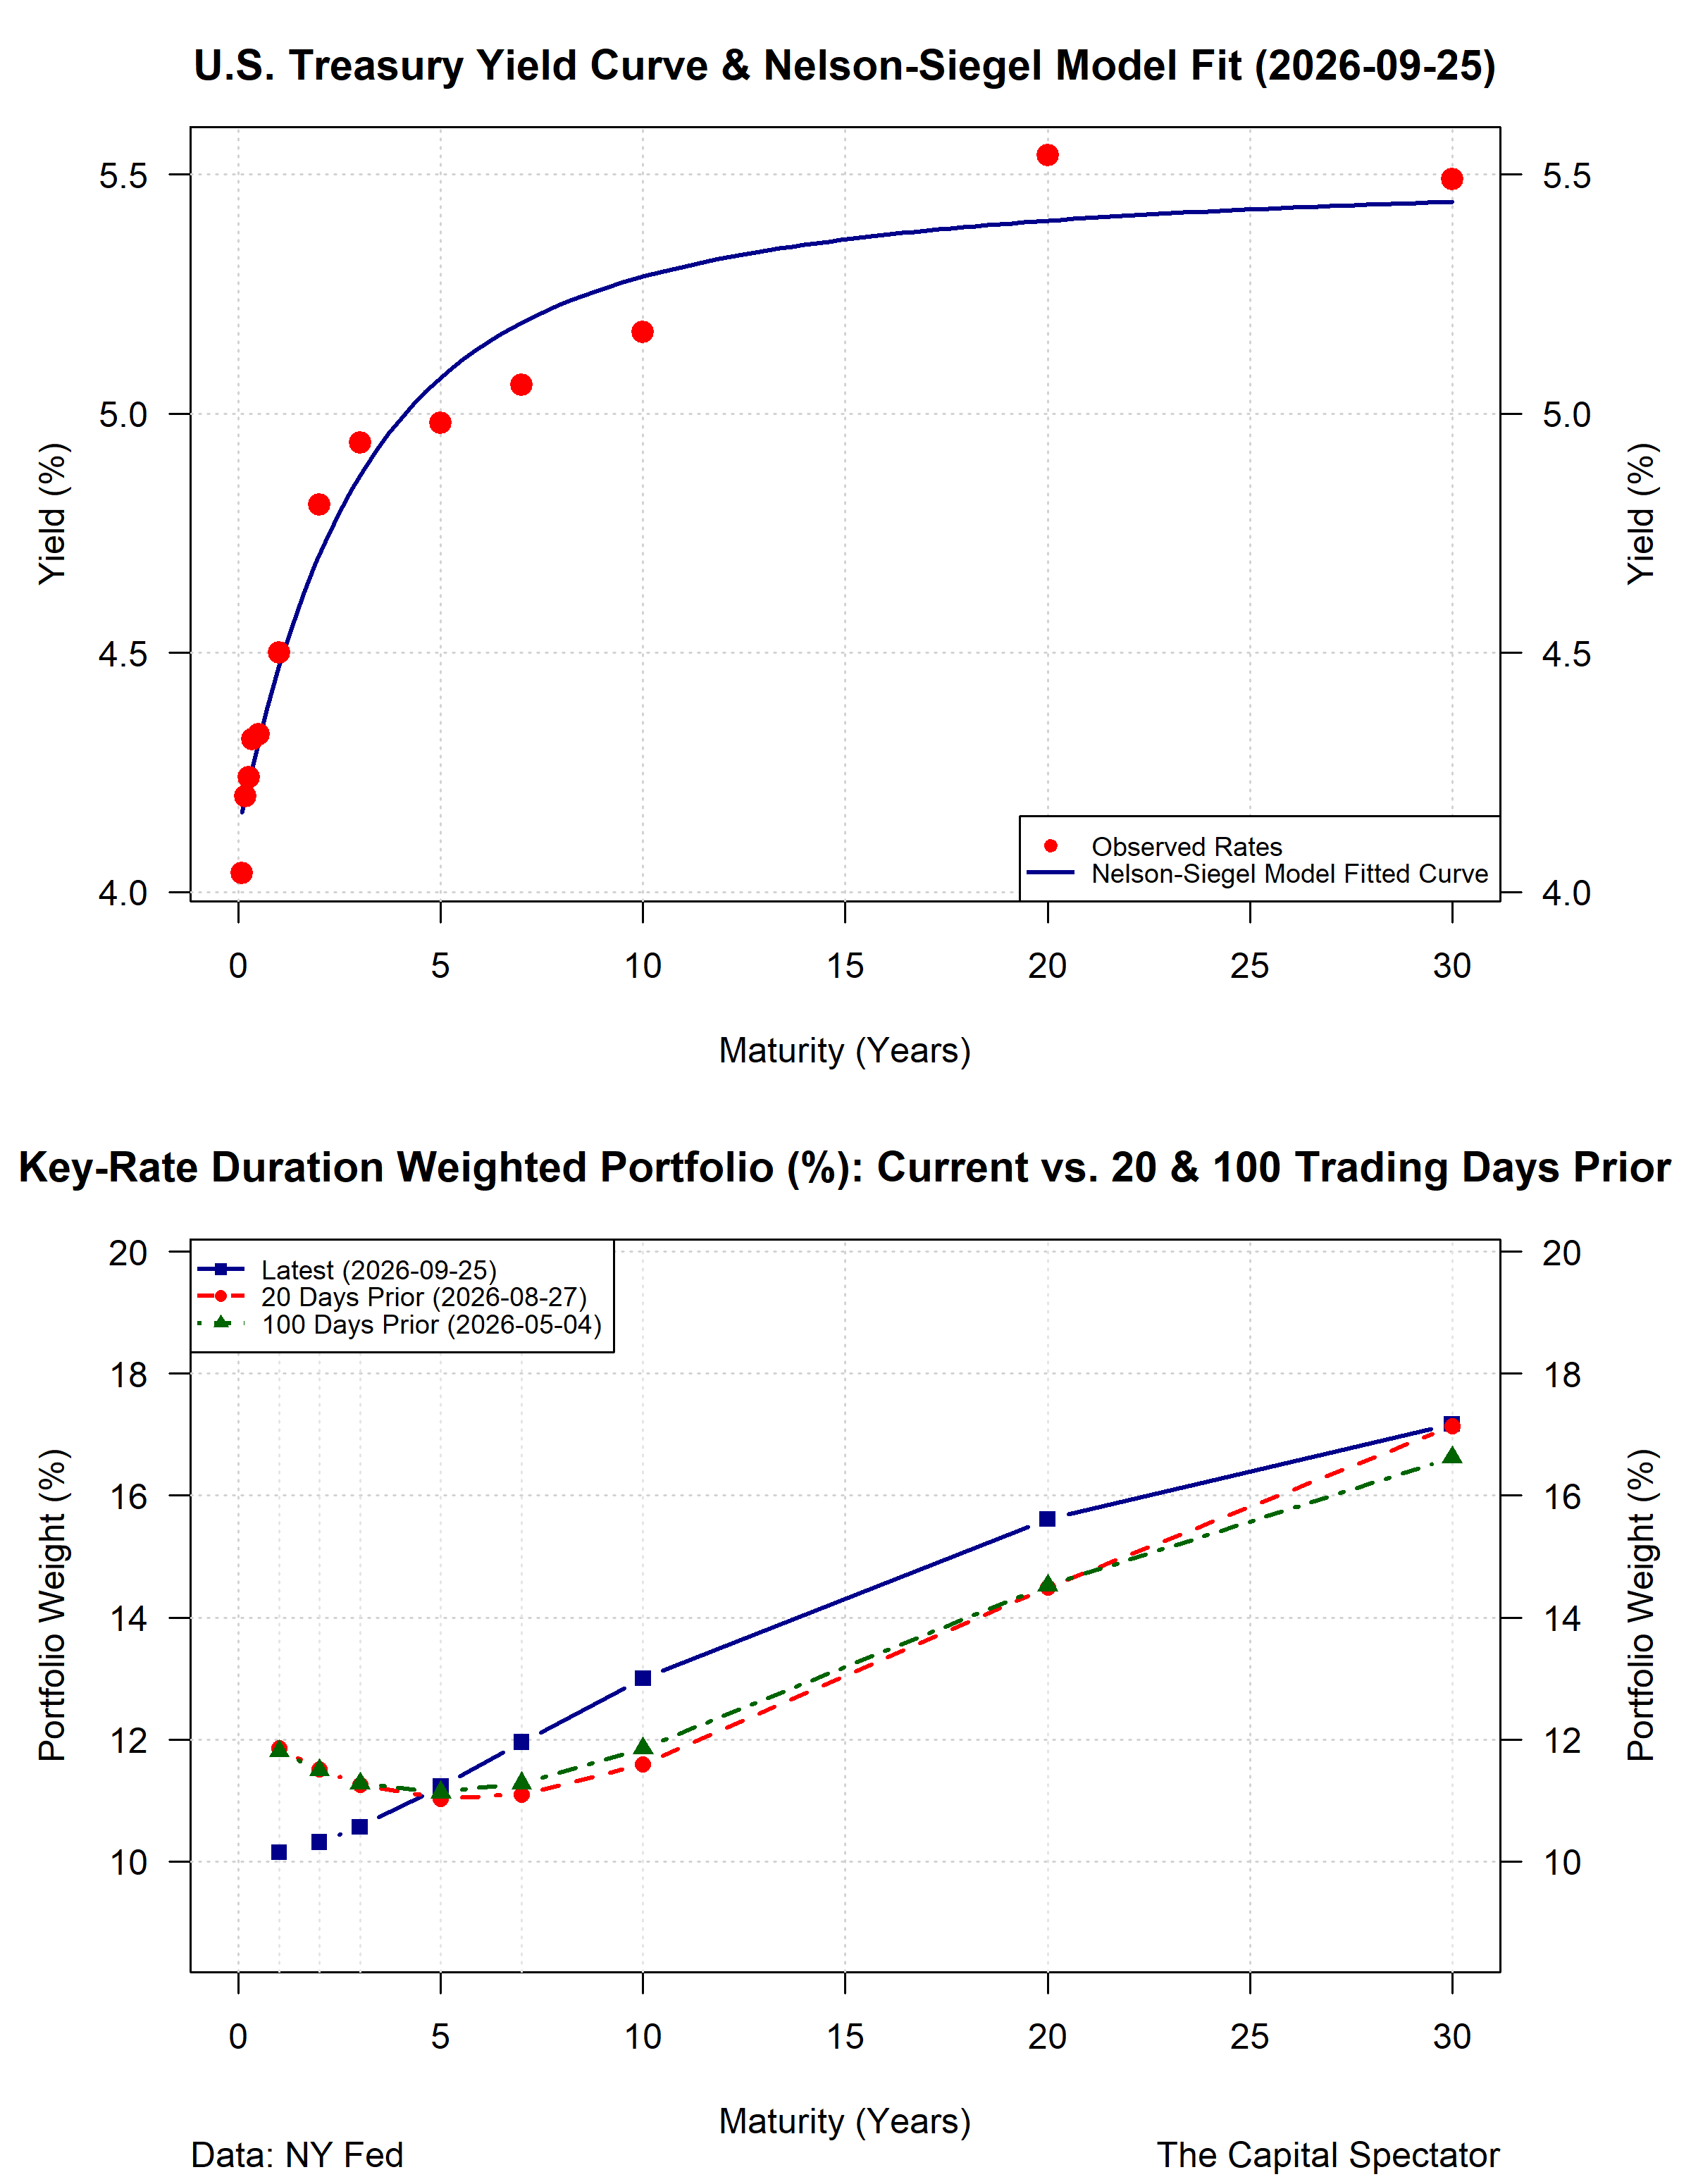
The current allocation is shown in the bottom chart (blue line) and is compared with results based on data from 20 and 100 days earlier.
The main takeaway is that the recommended weights have recently increased for maturities roughly between 7 and 20 years. Trend analysis suggests that yields will continue to climb, which implies that the model above may continue lifting weights for some maturities in the belly of the curve in the near future.
Rising yields have been painful for bondholders, but they are also creating opportunities that haven’t existed in years. As income levels improve across the curve, the focus increasingly shifts from simply managing downside risk to identifying where investors are being best compensated for taking duration risk. That’s a calculation that will continue to evolve as the Treasury market searches for its next equilibrium.
Is Recession Risk Rising? Monitor the outlook with a subscription to:
The US Business Cycle Risk Report
Author: James Picerno