

Where’s The Downside Tipping Point For US Stocks?
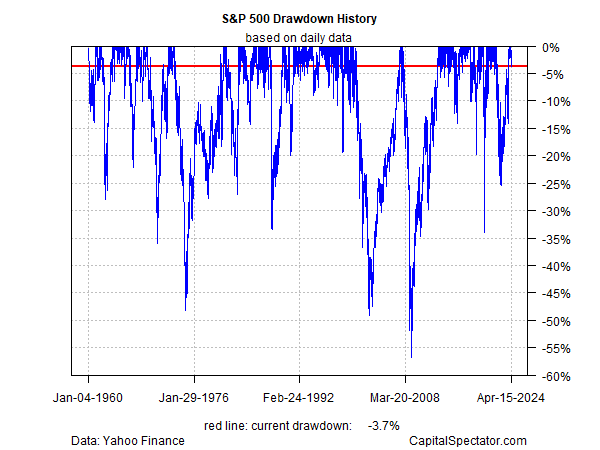
Yesterday’s sharp slide in US equities has refocused minds on a hardy perennial: the market can and does go down… Deciding whether the market’s latest gyrations are noise or signal is the art/science of market analysis… The market yesterday (Apr…7% below its previous peak – a drawdown th…
Yesterday’s sharp slide in US equities has refocused minds on a hardy perennial: the market can and does go down. Obvious, of course, but easy to overlook when prices are rising virtually non-stop, as they have been for much of the past six months—until now.
The latest decline has grabbed the crowd’s attention for several reasons, including the fact that the selling comes at a time of new questions about inflation and Fed policy and heightened risk of a widening Middle East conflict. Deciding whether the market’s latest gyrations are noise or signal is the art/science of market analysis. There are no flawless techniques for divining the future, but there are several techniques to maintain perspective, which can be a foundation for making informed decisions on how and when to rebalance portfolios.
Let’s start by reminding ourselves that the current drawdown for the S&P 500 Index is still mild by historical standards. The market yesterday (Apr. 15) closed 3.7% below its previous peak – a drawdown that’s irrelevant in the grand scheme of market history for peak-to-trough declines. What would constitute a possible early warning of deeper trouble ahead? There’s no magic number, but if the market slides further, and slips below a -5% drawdown, that would catch my attention.

Another way to try to separate the wheat from the chaff: monitoring how the S&P trend profile evolves. A conventional approach is to watch the 50- and 200-moving averages. By that standard, we’re still a long way from a sell signal, at least for strategic-minded investors with medium-/long-term horizons.

Every bear market starts with a relatively soft, innocuous slide, however, and so there’s a case for keeping an eye on a shorter set of moving averages as a possible early warning sign. The hazard here is that shorter time frames suffer from a higher degree of noise and so extra caution is required. For the moment, there’s still no smoking gun, even for a shorter-term perspective. Notably, the S&P’s 20-day average is still comfortably above its 50- and 100-day counterparts.

Another way to minimize noise is to focus on weekly charts. As the next chart highlights, the trend remains firmly positive from this perspective, based on 10- and 40-week averages.

The analysis above barely scratches the surface of techniques for highlighting signal and minimizing noise, but it’s a reasonable way to begin. To refine the process further we can add in volatility and valuation profiles, and on those fronts the results skew toward adopting a more cautious risk posture. To summarize, market valuation is high and recent volatility has been low – a combination that suggests the odds of a market correction are elevated vs. recent history.
Learn To Use R For Portfolio Analysis
Quantitative Investment Portfolio Analytics In R:
An Introduction To R For Modeling Portfolio Risk and Return![]()
By James Picerno
Add in the recent rise in geopolitical risk via the still-evolving Israel-Iran conflict and it’s getting easier to rationalize the case for paring risk exposure.
Another dimension that helps determine how, or if, to change your risk positioning: investment time frame. For short-term speculators, there’s a relatively strong(er) case for taking money off the table – less so, at least for now, for medium-/long-term investors.
The pushback to all of this is that a buy-and-hold strategy will win in the end. Point taken, and for some investors that’s the superior choice. But the assumption here is that you’re truly a buy-and-hold investor. Easy to say, hard to do, which is why risk management over shorter time frames is practical if not always optimal.

Author: James Picerno